


Choosing the right chart time frame can make day trading easier. For most day traders, the best time frame chart is the 5-minute or 15-minute for finding entries, backed by the 1-hour for context. That pairing gives you enough candles to find setups and enough structure to avoid reacting to every small price swing.
The time frame is not what makes you money, though. Your strategy creates the edge. A setup with a tested advantage tends to work on several charts, and a weak one fails on all of them. The goal is to pick a chart that fits your strategy, your account, and your schedule, then stick with it long enough to judge the results.
Understanding Chart Time Frames
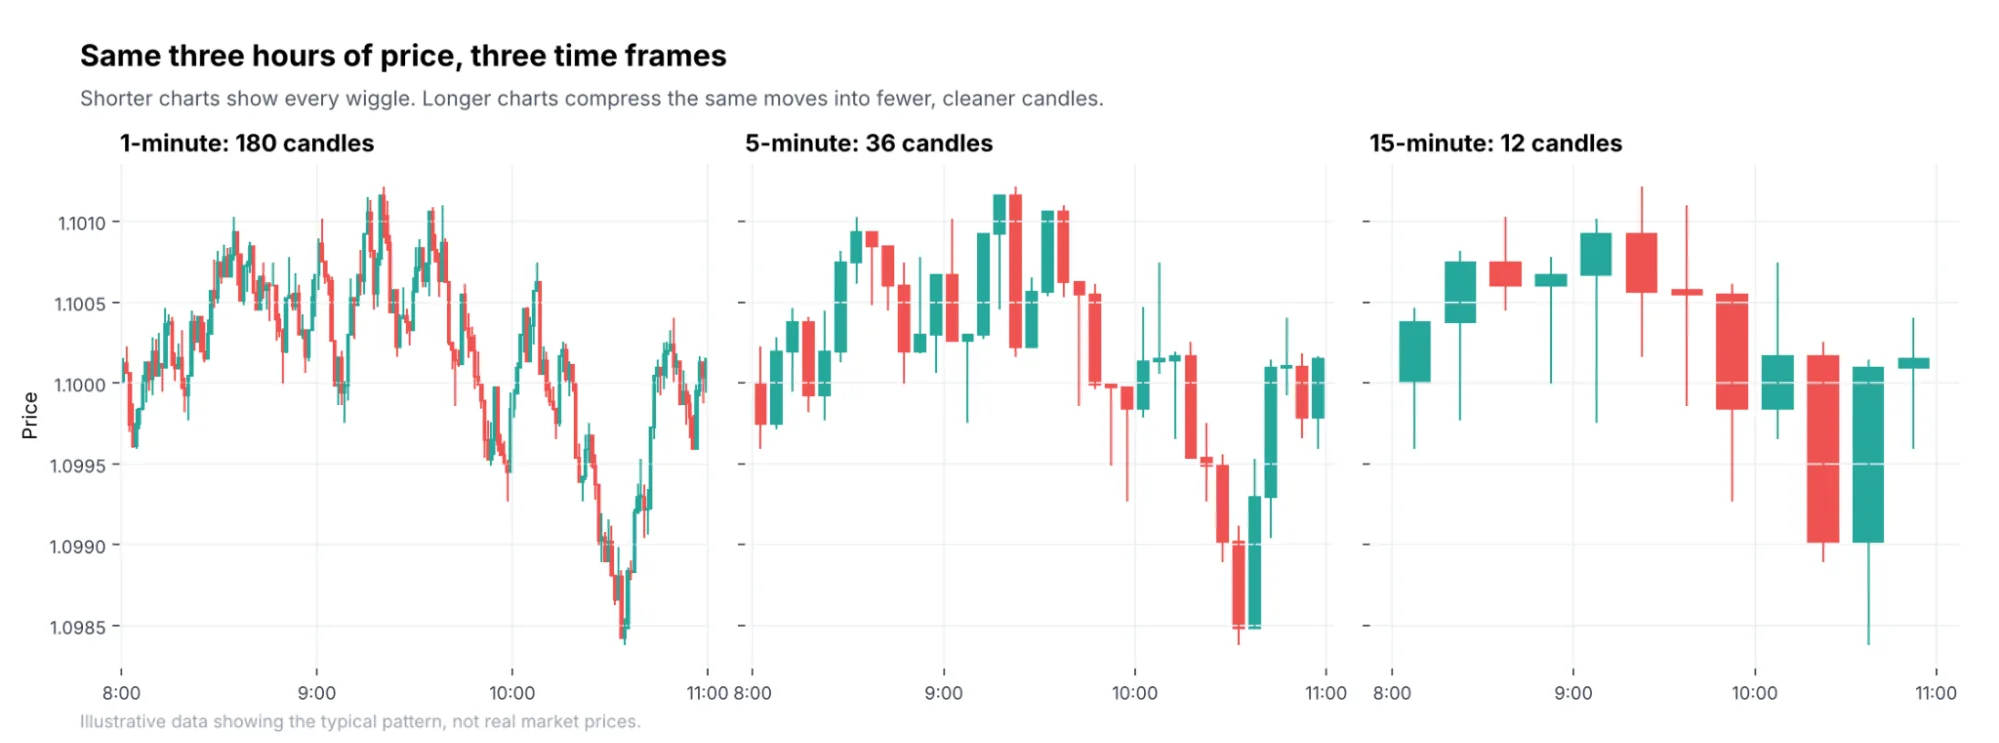
A time frame sets how much trading activity each candle, bar, or point on a price chart covers. On a 5-minute chart, every candle shows the open, high, low, and close for 5 minutes of trading. On a 1-hour chart, each candle compresses 60 minutes into one bar.
Short time frames show more detail, produce more signals, and react fast, but they also include more noise, meaning small moves that mean little. Longer intervals filter out some of these smaller movements, making trends and important price levels easier to recognize, but they give fewer signals and slower confirmation.
Day Trading Time Frames Compared
Here is a quick side-by-side view of the main options.
| Time frame | Advantage | Noise level | Typical stop size | Best suited to |
|---|---|---|---|---|
| 1-minute | Precise entries and frequent signals | High | Very tight | Experienced scalpers with fast execution |
| 5-minute | Balance between detail and clarity | Moderate | Small to medium | Most active day traders |
| 15-minute | Clearer trends and price structures | Lower | Medium | Part-time traders, beginners |
| 30-minute / 1-hour | Broader intraday view and shows major market direction | Low | Wide | Context, bias, slower day trades |
| Tick chart | Reflects trading activity | Moderate | Tight to medium | Futures scalpers |
1-minute chart
The 1-minute chart is the fastest standard option. It shows the earliest signs of a move and lets you place very tight stops, which means you can size up without risking more capital. It lets traders follow price movements closely and react quickly to changes in momentum.
Pros
- Provides precise entry and exit opportunities.
- Helps identify short-term momentum changes.
- Shows quick reactions around support and resistance.
Cons
- Heavy noise and frequent false signals.
- Requires constant attention and quick decisions.
- Spreads, commissions, and slippage can eat into small profits.
Best use
Scalping liquid instruments, or fine-tuning an entry once a higher chart has already given you a setup.
5-minute chart
The 5-minute chart is one of the most popular day trading time frames, and for good reason. It provides enough detail to identify pullbacks, breakouts, and short-term trends without showing every small price fluctuation.
Pros
- Balances price detail with a clearer market structure.
- Provides regular trading opportunities.
- Works well with price action and technical indicators.
Cons
- Can still produce false signals in sideways markets.
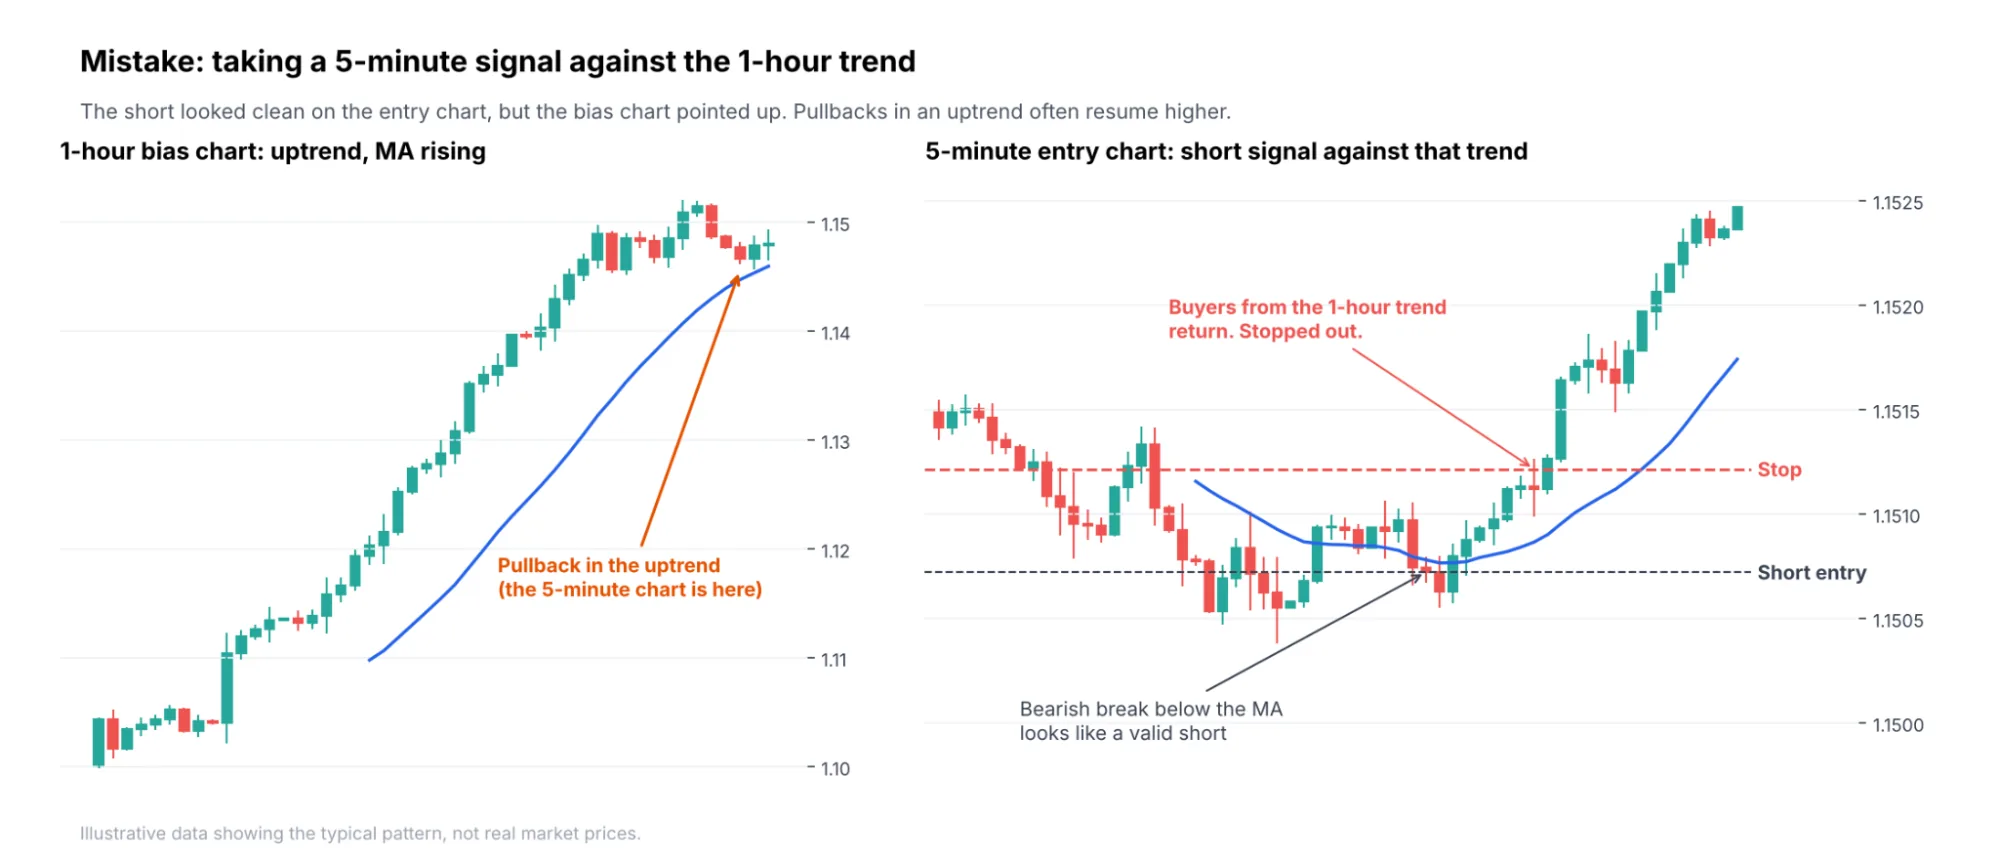
- Short-term movements may conflict with the broader trend.
- Requires regular monitoring during active sessions.
Best use
Momentum trades, VWAP setups, opening range trades, and general intraday trading in stocks and futures.
15-minute chart
The 15-minute chart slows things down, making it easier to identify trends, consolidation zones, and important price levels. Support and resistance are easier to spot, and false breakouts show up less often.
Pros
- Makes intraday trends easier to recognize.
- Reduces distractions from minor price movements.
- Works well for breakout and trend-following strategies.
Cons
- Entry signals develop more slowly.
- Some short-lived opportunities may disappear before a candle closes.
Best use
Traders who prefer fewer, more deliberate trades. It works well for beginners building discipline, and anyone trading breakouts from clearly defined levels.
30-minute and 1-hour charts
These are better thought of as map charts than entry charts. The 30-minute and 1-hour charts provide a broader view of the market.
Pros
- Makes broader trends and important price levels easier to identify.
- Helps traders avoid positions that go against the wider market direction.
Cons
- Provides fewer trading opportunities.
- Provides less detail for precise entries.
Best use
Setting the daily bias and marking important levels. They’re generally better for market analysis.
Tick charts
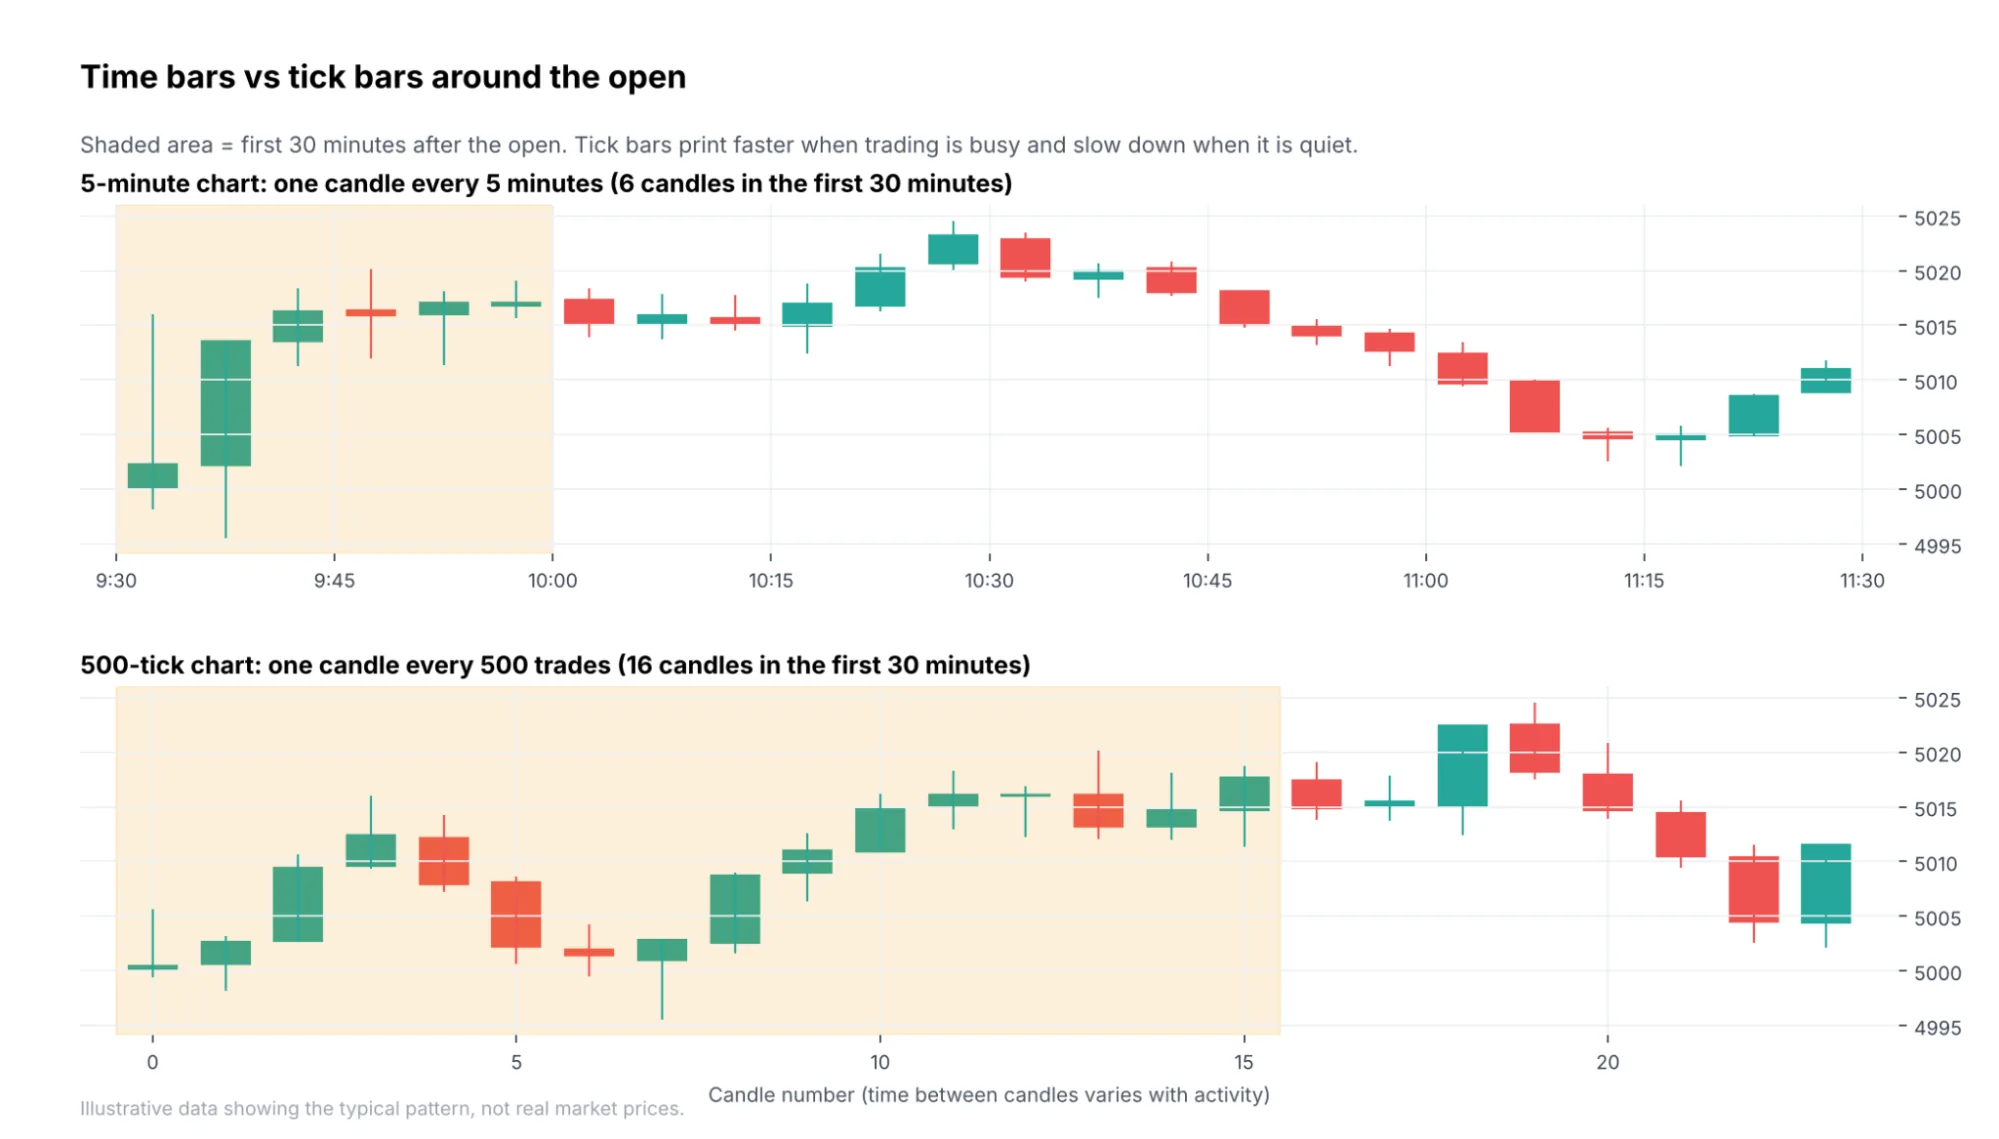
A tick chart creates a new candle after a set number of transactions, instead of after a set amount of time. A 500-tick chart forms a new candle after 500 trades.
Pros
- Candles reflect real market activity.
- Provides more detail during high trading activity.
- Helps monitor short-term momentum.
Cons
- Takes time to understand and interpret.
- May be less useful in markets with limited transaction data.
Best use
It suits futures traders and scalpers, especially in index futures, where volume is deep and consistent.
How to Choose Your Time Frame
Your trading strategy is important, but it’s not the only thing to consider. Factors like risk tolerance, available capital, and daily schedule also influence which chart interval works best.
Noise and trade frequency
Shorter time frames produce more signals because they display smaller price movements. If you notice that you take a lot of trades, moving up one time frame often fixes it without any change to your rules.
Figure out how many good setups your strategy really needs. If you want two to four quality trades per day, a 5-minute or 15-minute chart usually delivers that. If you’re a scalper, you are looking at the 1-minute or a tick chart.
Stop size, position size, and account size
Your time frame also sets your typical stop distance. Shorter intervals often produce smaller price swings and tighter technical stops, while longer intervals may require wider stops.
This matters for small accounts. If your account is small and your stop is wide, the position you can afford may be small, and fees will eat into that. Many small-account traders end up on the 1-minute or 5-minute chart because the tighter stops let them hold a meaningful position size at a low capital risk.
In futures, contract size matters as much as the chart. The E-mini S&P 500 (ES) moves $12.50 per tick and $50 per point. The Micro E-mini (MES) is one-tenth the size, at $1.25 per tick and $5 per point. An 8-point stop on a 15-minute chart costs $400 per ES contract but $40 per MES contract. On a $10,000 account risking 1% ($100), one ES contract is too large, while two MES contracts ($80 risk) fit. Schwab’s guide explains how tick sizes and values work across stock index futures.
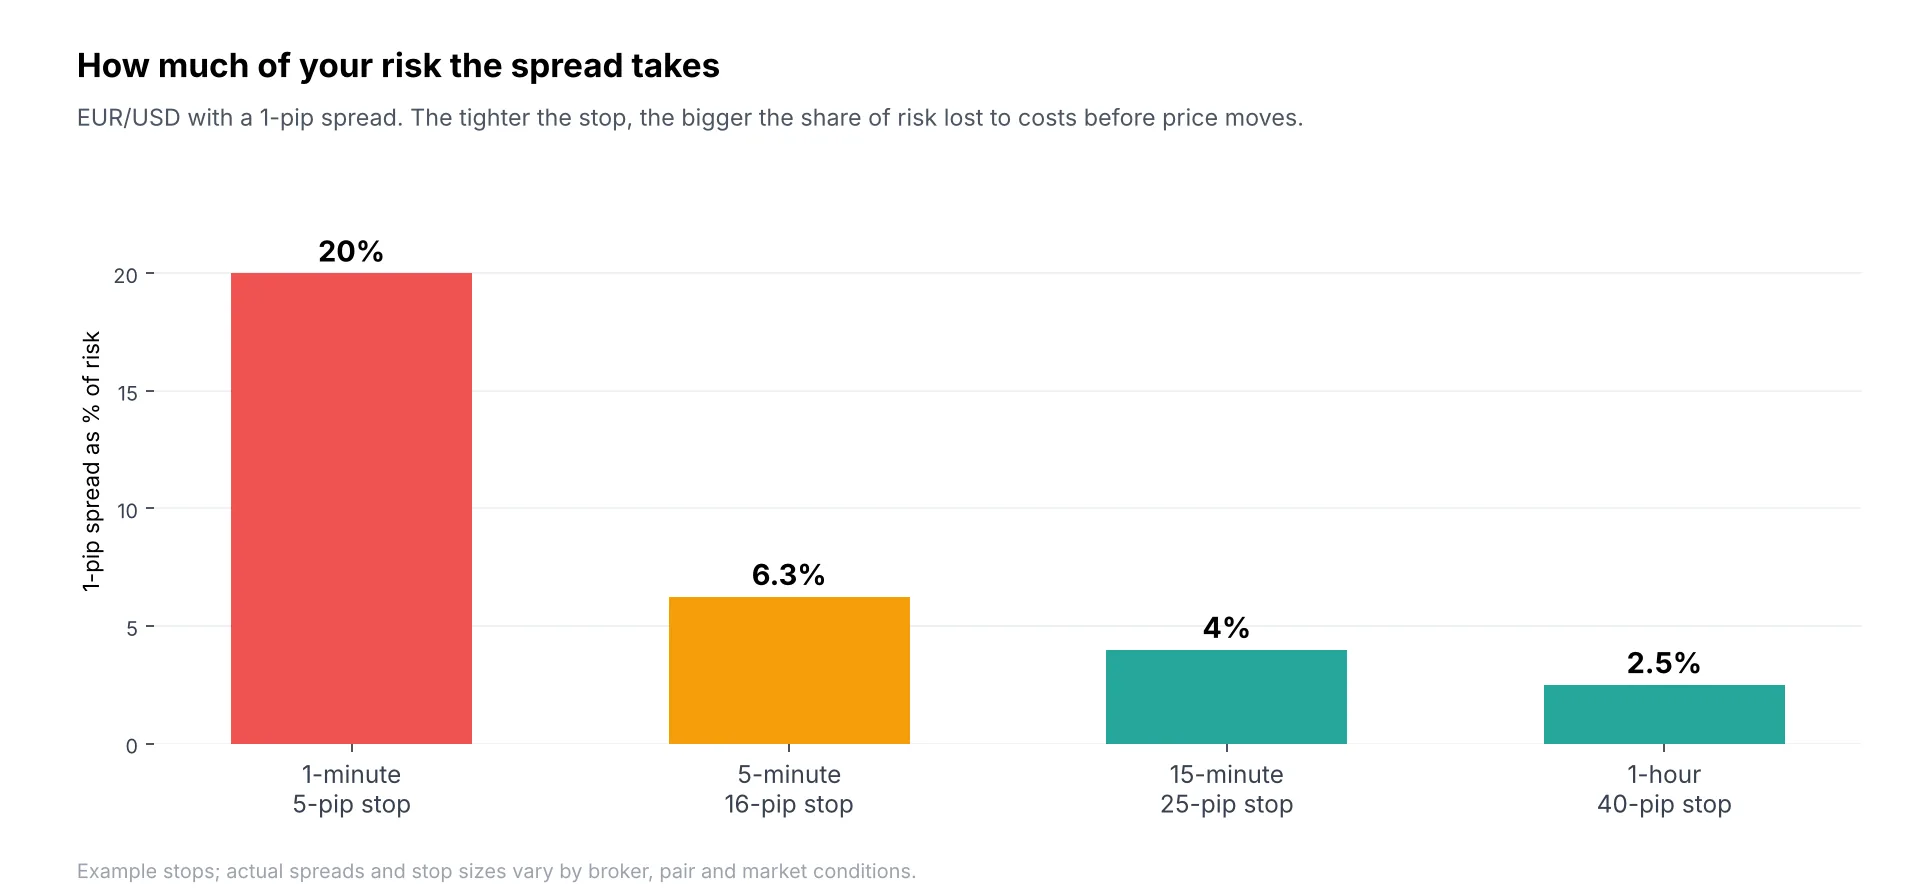
Trading costs also hit shorter charts harder. With a 1-pip spread on EUR/USD, a 5-pip scalp on the 1-minute chart gives up 20% of its risk before price moves. The same spread on a 16-pip stop costs about 6%.
SEC Day Trading Rule Update: On April 14, 2026, the SEC approved the elimination of the Pattern Day Trader (PDT) designation and its mandatory $25,000 minimum equity requirement. The replacement risk-based framework took effect on June 4, 2026, with full broker implementation required by October 20, 2027. Once a broker adopts the new framework, traders with smaller accounts can day trade without triggering a PDT designation based on trade count, subject to intraday margin requirements and the broker’s own rules.
Schedule, screen time, and psychology
Consider how much time you can spend watching the market. If you can monitor the market for only an hour around the open, you need a chart that produces usable setups in that window. Short time frames like the 1-minute chart require frequent monitoring and quick decisions.
Psychology is just as important. If you become impatient waiting for a 15-minute candle to close, you may struggle to follow that strategy. In the same way, the constant activity on a 1-minute chart can encourage impulsive decisions.
Best Time Frame by Strategy
Different strategies need different amounts of detail. Use this table as a starting point, then adjust after testing.
| Trading Strategy | Preferred Time Frame | Why it fits |
|---|---|---|
| Scalping | 1-minute or tick | Finds quick price movements and precise entries. |
| Momentum | 5-minute and 15-minute | Tracks strong price movements and pullback opportunities. |
| VWAP | 1-minute, 5-minute, and 15-minute | Monitors price reactions around VWAP. |
| Breakout | 5-minute or 15-minute | Identifies consolidation and confirms potential breakouts. |
| News trading | 1-minute or 5-minute | Tracks immediate reactions to economic releases and announcements. |
Best Time Frame by Market
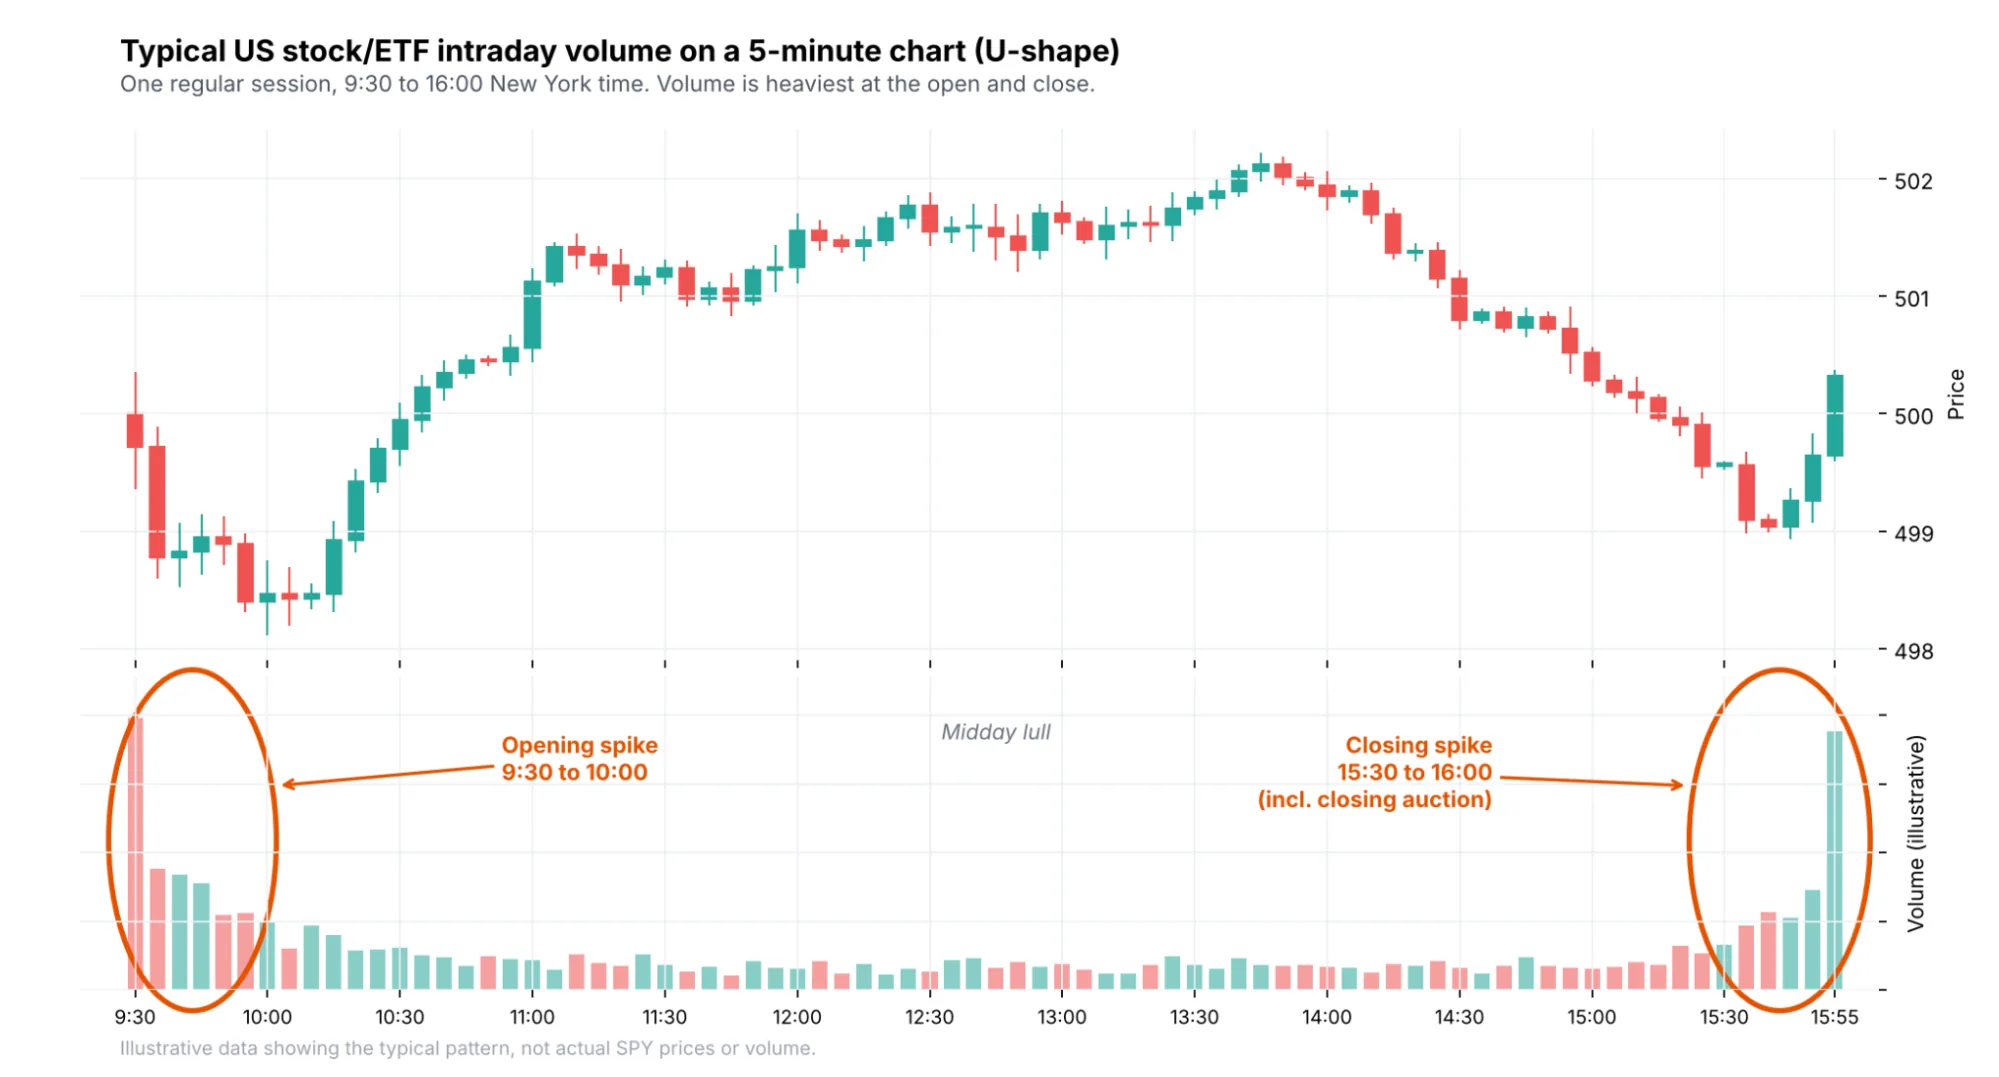
Stocks: The 5-minute chart is the standard for individual stocks, with the 15-minute and 1-hour charts as context. Volume is heaviest near the open and close. The closing auction alone is the single largest liquidity event of the day, handling roughly 9% of total US daily volume in 2024. The 1-minute and 5-minute charts tend to be most useful in the first 90 minutes of the session.
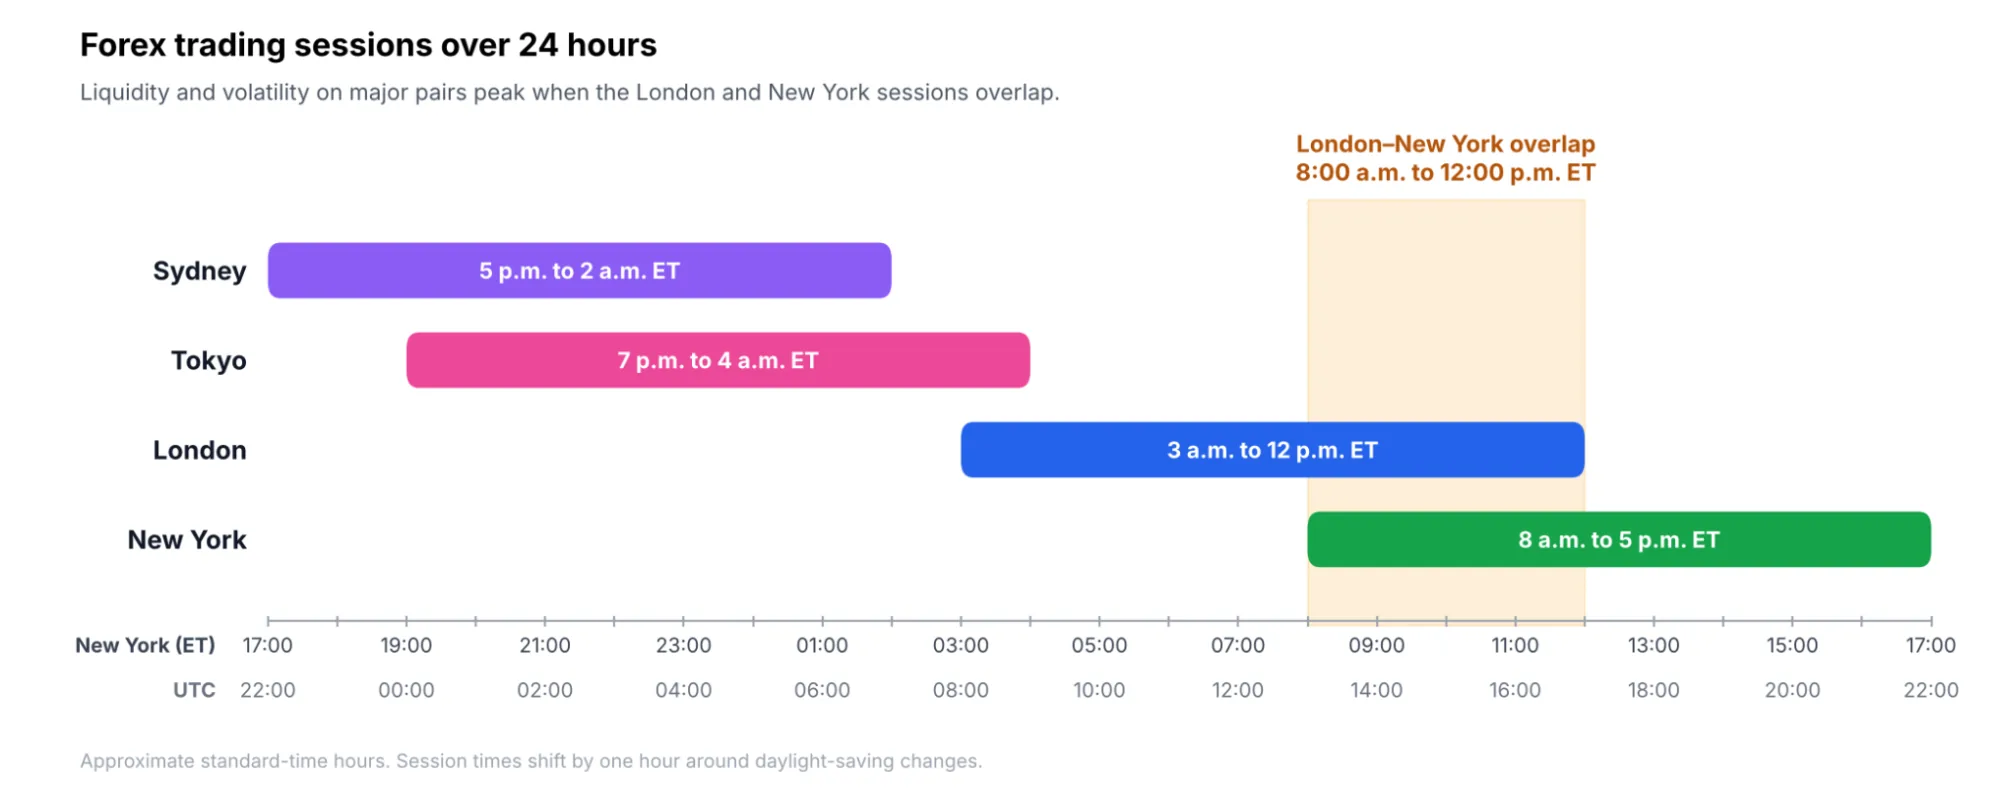
Forex: The 5-minute and 15-minute charts are practical for intraday currency trading. The 1-hour chart helps establish direction, particularly around major economic announcements and the London and New York sessions. Forex is the largest market in the world, averaging $9.6 trillion in daily turnover in April 2025. Liquidity peaks during the London–New York overlap, roughly 8:00 a.m. to 12:00 p.m. New York time, which is when 5-minute setups on major pairs tend to be cleanest.
Futures: Index futures like the E-mini S&P 500 and Nasdaq are deep and fast, so they suit the 1-minute, 5-minute, and tick charts. Gold futures often move in strong bursts around economic data and the New York open, and the 5-minute and 15-minute charts keep those moves readable.
Crypto: Crypto trades 24 hours a day, every day. Volatility can jump at any hour, and weekends are often thinner and more erratic. The 5-minute and 15-minute charts help identify intraday opportunities, while the 1-hour chart provides market context.
Multi-Time-Frame Analysis for Day Traders
Multi-time-frame analysis means using more than one time interval to study the same asset to make a trade. Instead of using one chart for every decision, you give each time frame a specific role.
Bias, setup, and entry framework
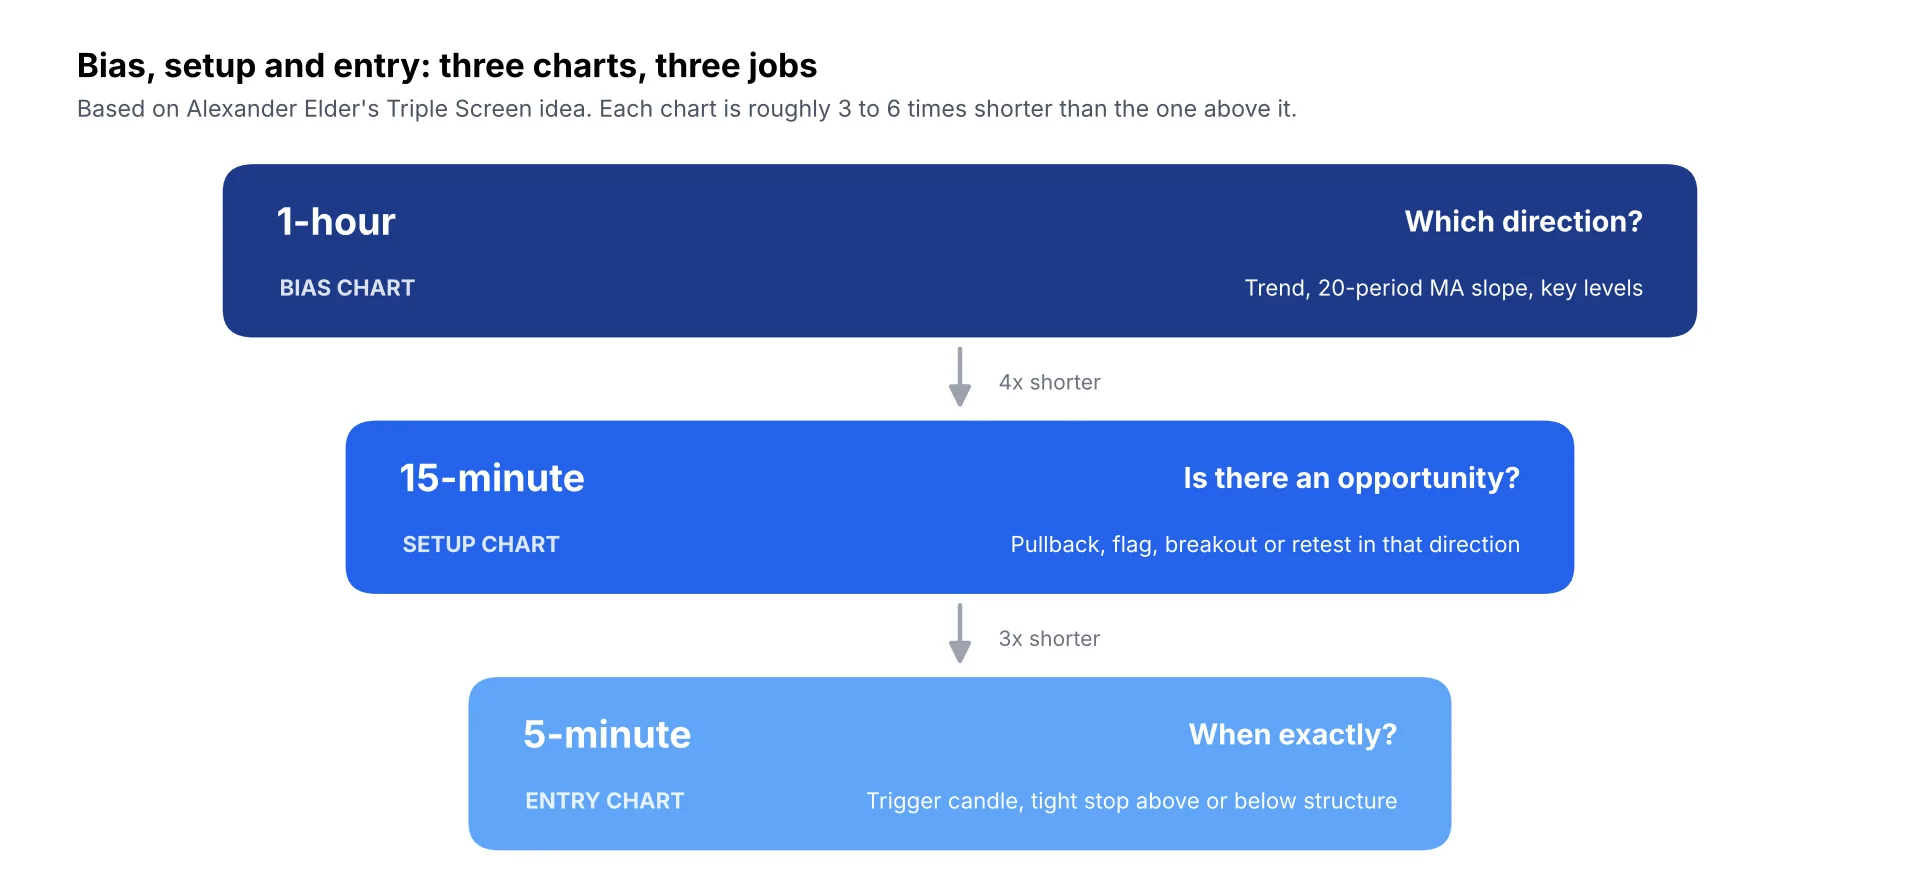
The three-chart setup below is based on Alexander Elder’s Triple Screen method. Elder suggested keeping each chart roughly five times the one below it, so the charts stay related without repeating each other. In practice, a factor of about 3 to 6 works, which is why 1-hour, 15-minute, and 5-minute is such a common set.
The simplest approach uses three charts, each with a job:
1. Higher time frame (bias chart): Establish market direction.
This tells you the overall market direction. Start with the 1-hour chart. Identify the prevailing trend, important support and resistance levels, and areas where price could encounter buying or selling pressure.
2. Middle time frame (setup chart): Find a setup.
Shows the pattern or condition you trade, such as a pullback, a flag, a breakout, or a retest around an important price level. Move to the 15-minute chart and look for an opportunity that fits the broader direction.
3. Entry chart (the lowest):
Lets you time the trigger with a tighter stop. Switch to the 5-minute chart to look for an entry trigger.
Here are chart combinations many day traders use:
| Trading style | Bias chart | Setup chart | Entry chart |
|---|---|---|---|
| Standard day trading | 1-hour | 15-minute | 5-minute |
| Faster day trading | 15-minute | 5-minute | 1-minute |
| Slower | 4-hour | 1-hour | 15-minute |
Worked example
In this example trading EUR/USD during the London–New York overlap, on the 1-hour chart, the 20-period moving average was sloping down, and price kept making lower highs: 1.1253, 1.1170, then 1.1103. There is clearly a downtrend bias.
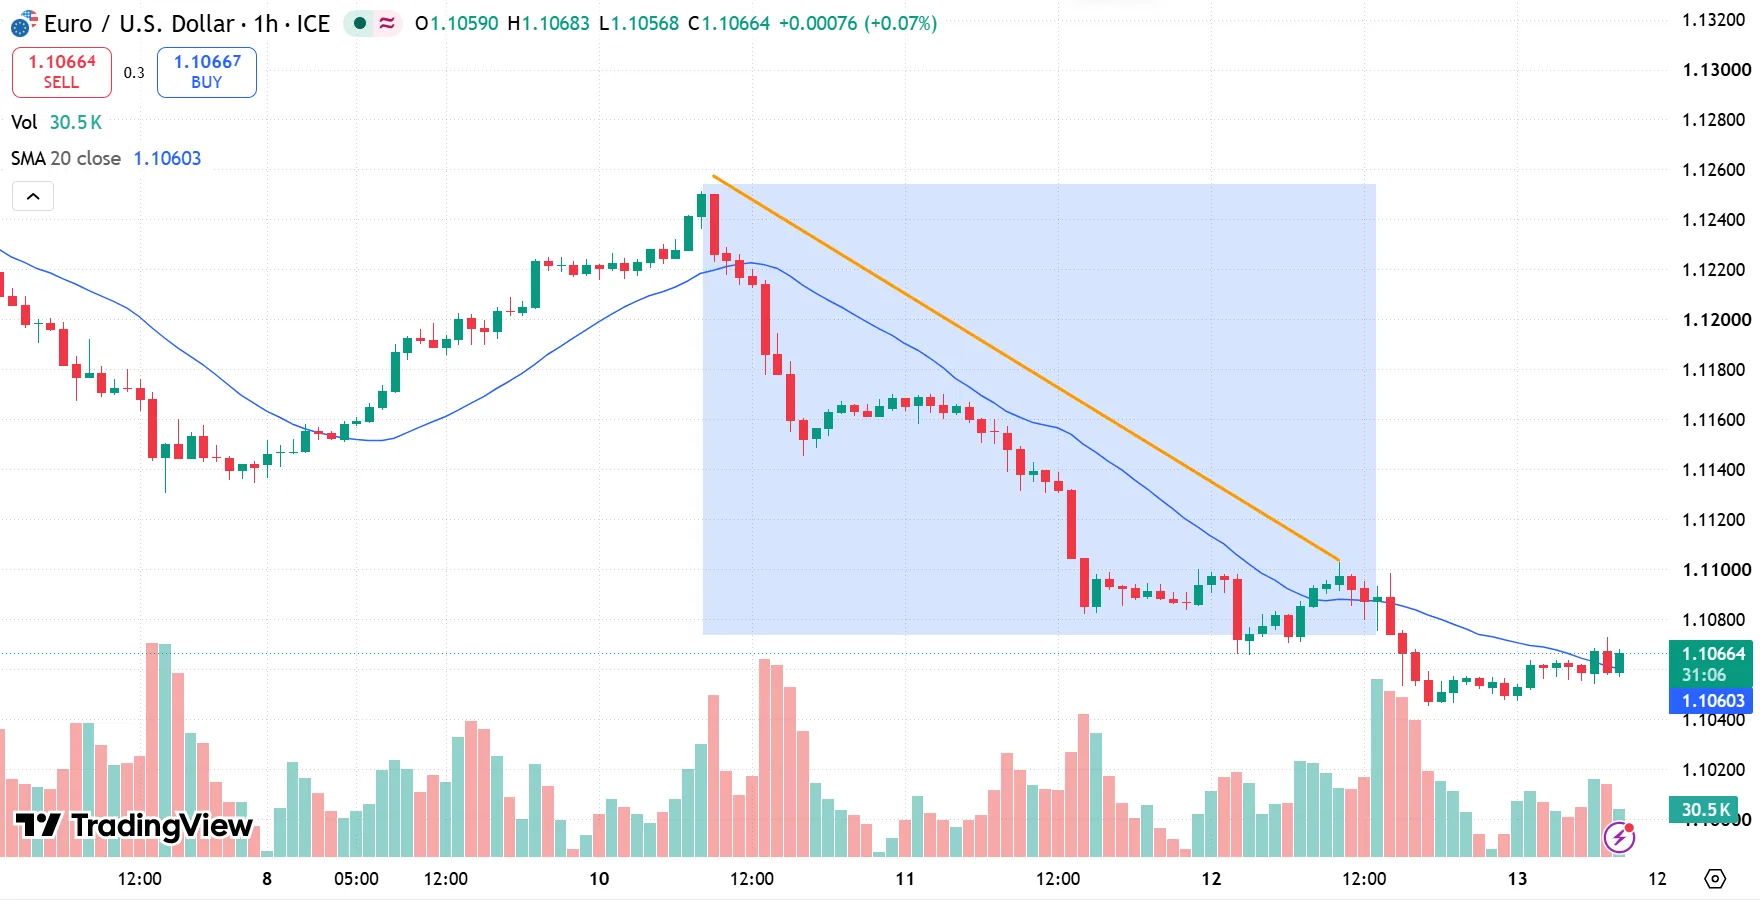
On the 15-minute chart, price fell to about 1.1076, then bounced 25 pips to 1.1101, a lower high just under the morning's 1.1103. That is your setup: a pullback in a downtrend.
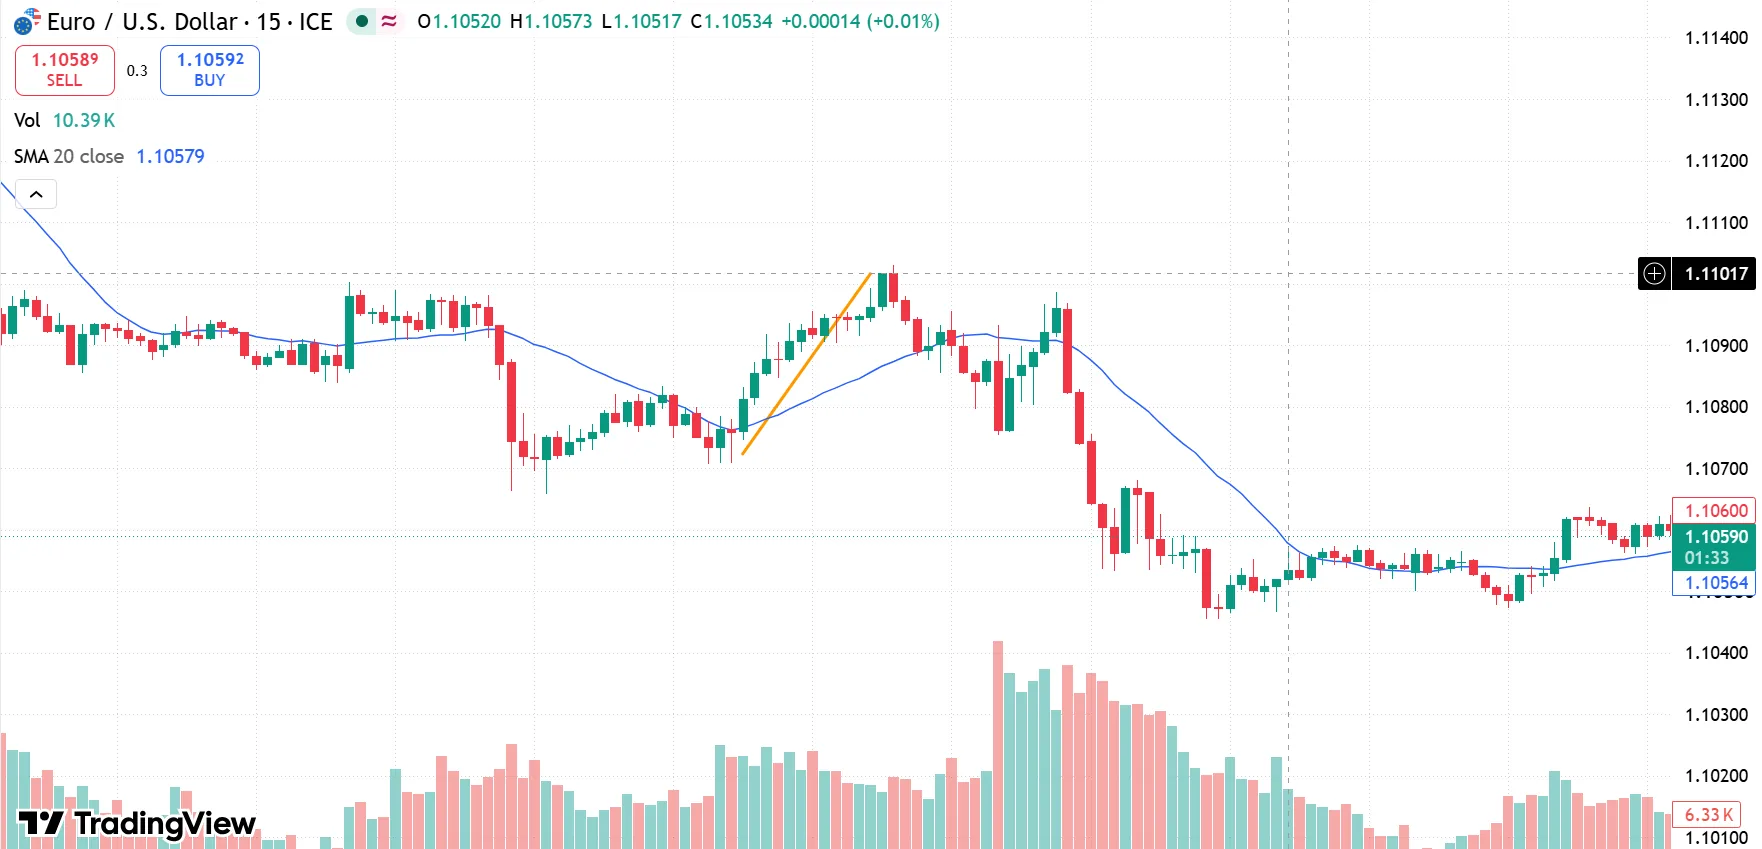
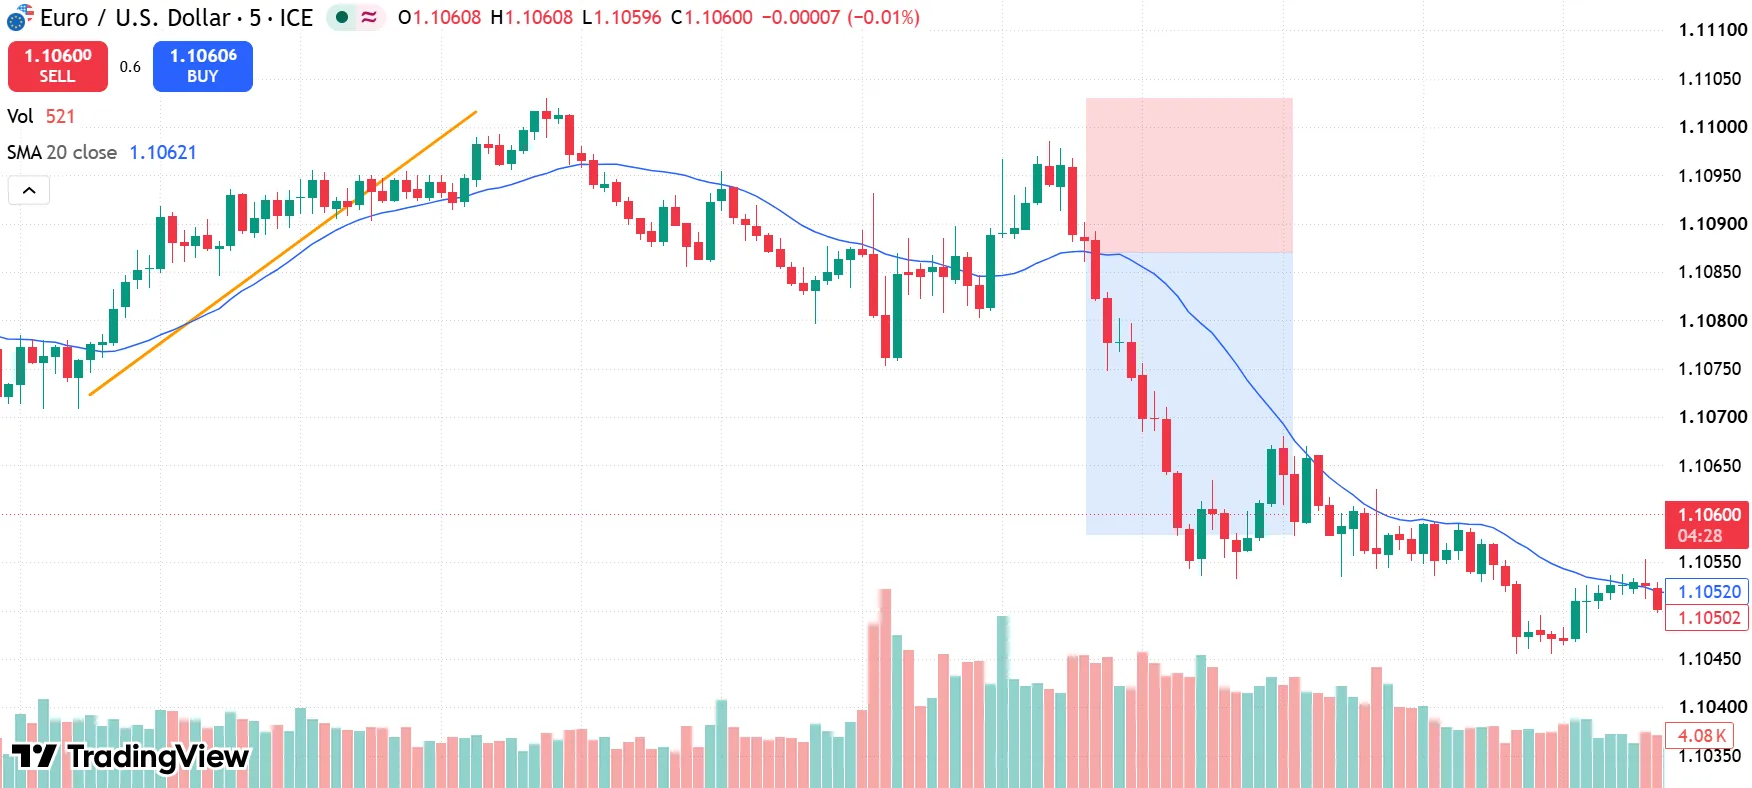
On the 5-minute chart, you wait. Price dropped back to the 20-period average, near 1.1087, and a bearish candle broke through it on rising tick volume. That is your trigger. You sell EUR/USD at 1.1087 with a stop at 1.1103, just above the bounce high and level, risking 16 pips. The first target is the swing low near 1.1058 (29 pips, about 1.8 to 1) and target 2 is at 1.1046 (41 pips, about 2.6 to 1). Price reached both targets that day without touching the 1.1103 stop level.
Position Sizing & Risk Example: On a $10,000 account risking 1% per trade ($100 risk), risking 16 pips ($160 per standard lot) translates to a position size of approximately 0.62 standard lots ($6.20 per pip movement).
Time Frame Mistakes Day Traders Make
Even with a great trading strategy, certain habits can make day trading more difficult. Here are a few mistakes traders make:
- Switching between charts too frequently: Constantly changing intervals or moving to a new time frame every time a trade fails can produce conflicting signals and make it harder to follow your strategy.
- Ignoring the higher time frame: Taking every 1-minute or 5-minute signal without checking the broader trend can put you on the wrong side of the market.
- Overtrading: Fast time frames create a constant stream of signals and can make traders feel that every fluctuation deserves a trade. This often leads to unnecessary entries and higher transaction costs. Set a daily trade limit and a minimum quality standard for setups.
- Using stops that do not match the chart: A stop sized for a 1-minute chart will get hit by normal movement on a 15-minute setup. Let the structure on your entry chart decide where the stop goes, then size the position to fit.
- Choosing a time frame based on profit potential: Shorter intervals show more price activity, not necessarily more profitable opportunities.
- Changing time frame mid-trade: If you entered on a 5-minute signal, do not drop to the 1-minute chart to justify holding a losing trade. Decide your exit rules before you enter.
How to Test a Time Frame Before Committing
Before using a chart interval for live trading, test how well it supports your strategy.
- Write down your rules: Clearly define your entry, stop, target, and filters.
- Backtest on at least 50 to 100 trades: Run the same rules on historical data for one time frame, then repeat on another. Only change the time frame and keep everything else the same.
- Track the numbers: Record win rate, average reward-to-risk, total return, maximum drawdown, and the number of trades. Include fees and a realistic estimate of spreads, commissions, and other trading costs.
- Forward test on a demo or with a small size: Run the strategy in real time for several weeks and test each interval across different market conditions. Keep your entry and exit rules consistent during testing.
- Compare results: Compare the number of valid trading opportunities, win rate, and average risk-to-reward ratio.
FAQs
What is the best time frame for beginners?
The 15-minute chart, with the 1-hour chart for context, is a good place to start. It gives you cleaner candles, fewer signals, and more time to think. That helps you build good habits before moving to the 5-minute chart.
Can you use a single time frame?
Yes, and many traders do. A single chart keeps things simple, and a well-tested strategy can work on one. The risk is missing context. If you stick with one chart, at least mark the previous day's high and low and any major levels from a higher time frame so you know where price may react.
Bottom Line
There is no single best time frame chart for day trading. The 5-minute and 15-minute charts offer a practical balance for many traders, while the 1-minute chart suits scalping and the 1-hour chart provides broader market context.
Choose the time frame that matches your strategy, market, account size, and schedule. Then test it, track your results, and give it enough trades to prove itself. Trading carries real risk of loss, and nothing here is financial advice.
Ready to take the next step? Explore AtlasFunded's prop trading programs today and put your trading skills to work with the capital to match.
Explore funding programs
 Senior Writer at Atlas Funded



 Your move
 Only pay the full fee after you pass

 UK
 ES
 DE
 FR
 IN
 IT