


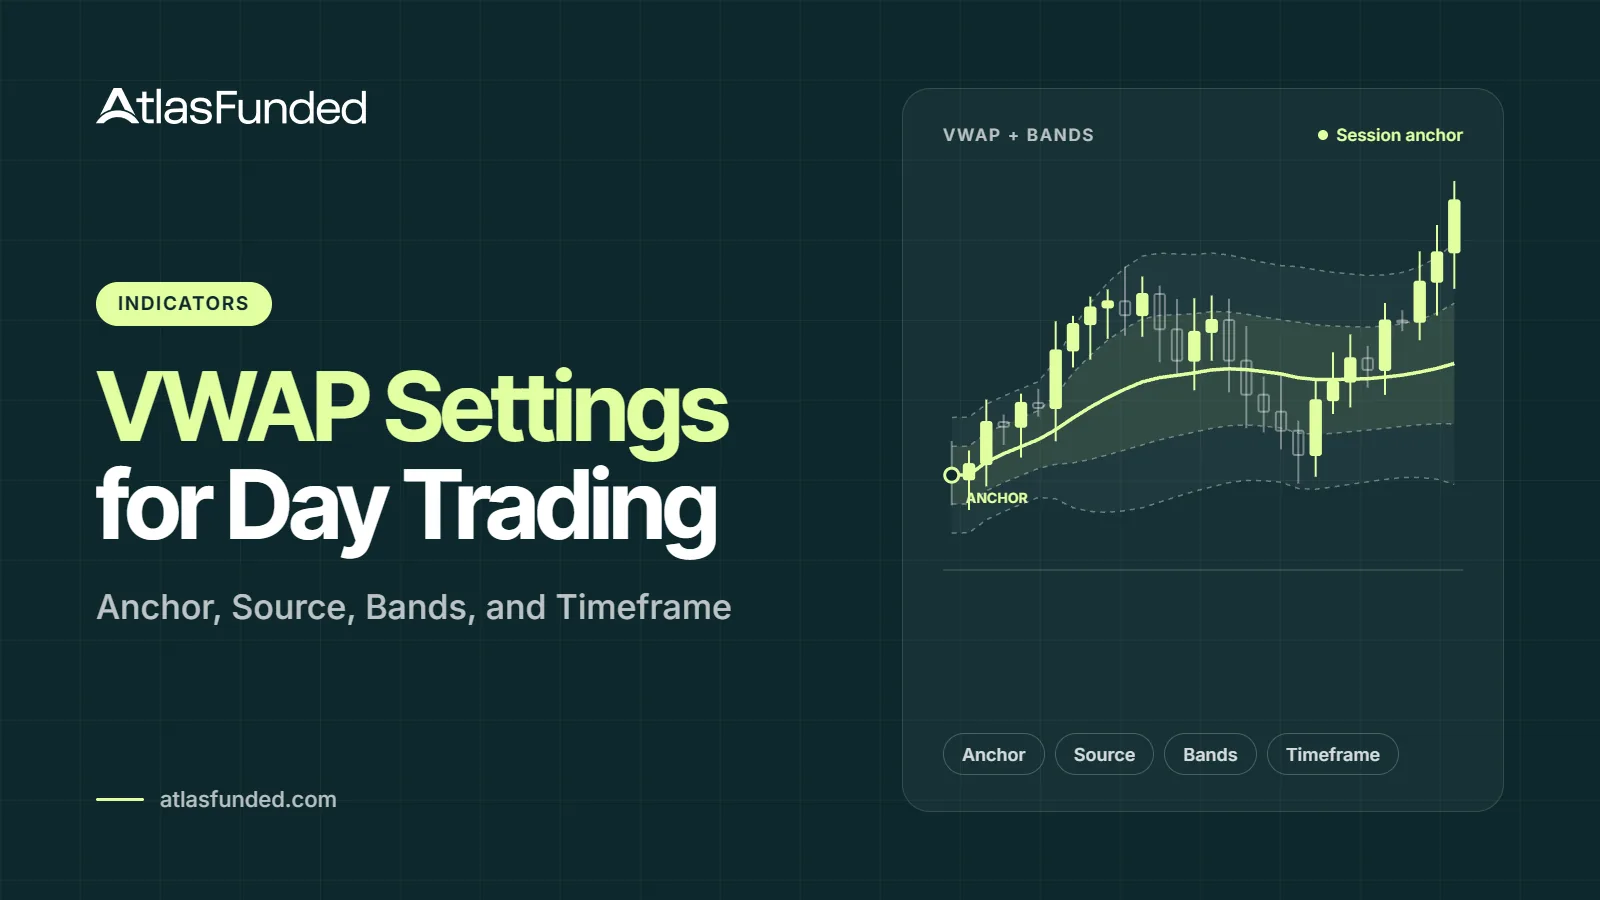
Day traders use VWAP to analyze market direction and identify potential entry and exit levels. For day trading, VWAP is commonly set to a Session anchor, HLC3 price source, and 1 and 2 standard deviation bands. A 5-minute chart works well for most intraday setups, while regular-session stock traders will usually want extended hours disabled.
VWAP doesn’t have a length input like a moving average, so these settings decide what the line shows, and many platforms preset them for you.
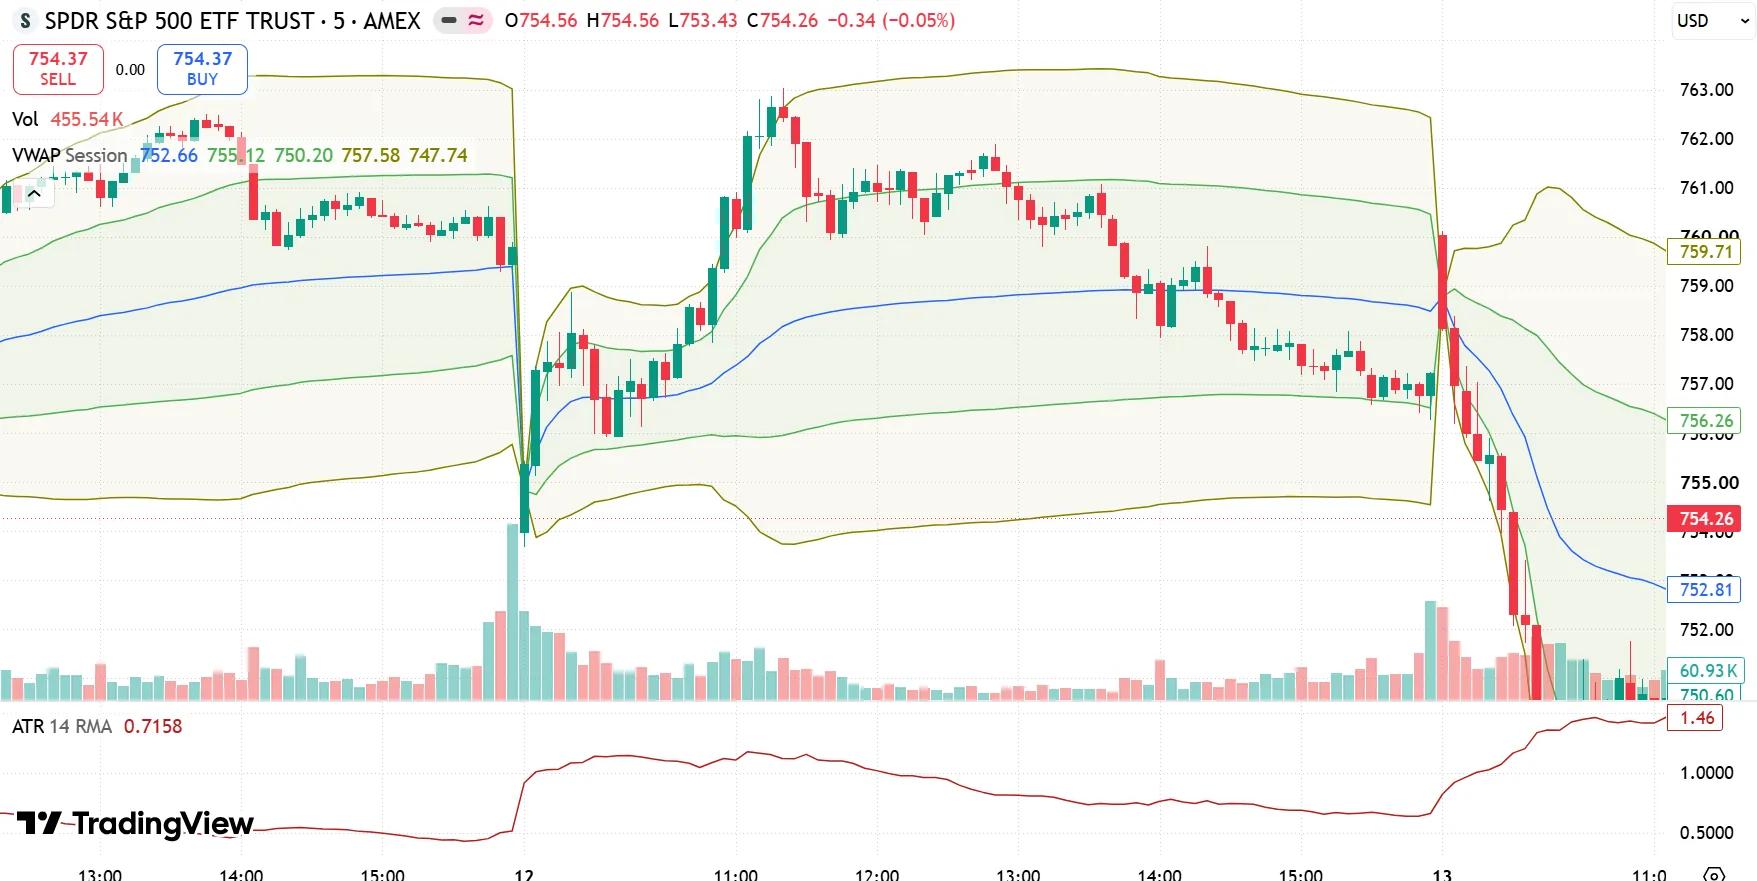
TradingView SPY 5-minute chart showing session VWAP and standard deviation bands
What VWAP Measures
Volume Weighted Average Price (VWAP) shows the average price an asset has traded at during a session, giving more weight to prices with higher trading volume.
Formula:
VWAP = Cumulative (Typical Price × Volume) ÷ Cumulative Volume
Typical price is usually the average of the high, low, and close:
(High + Low + Close) ÷ 3
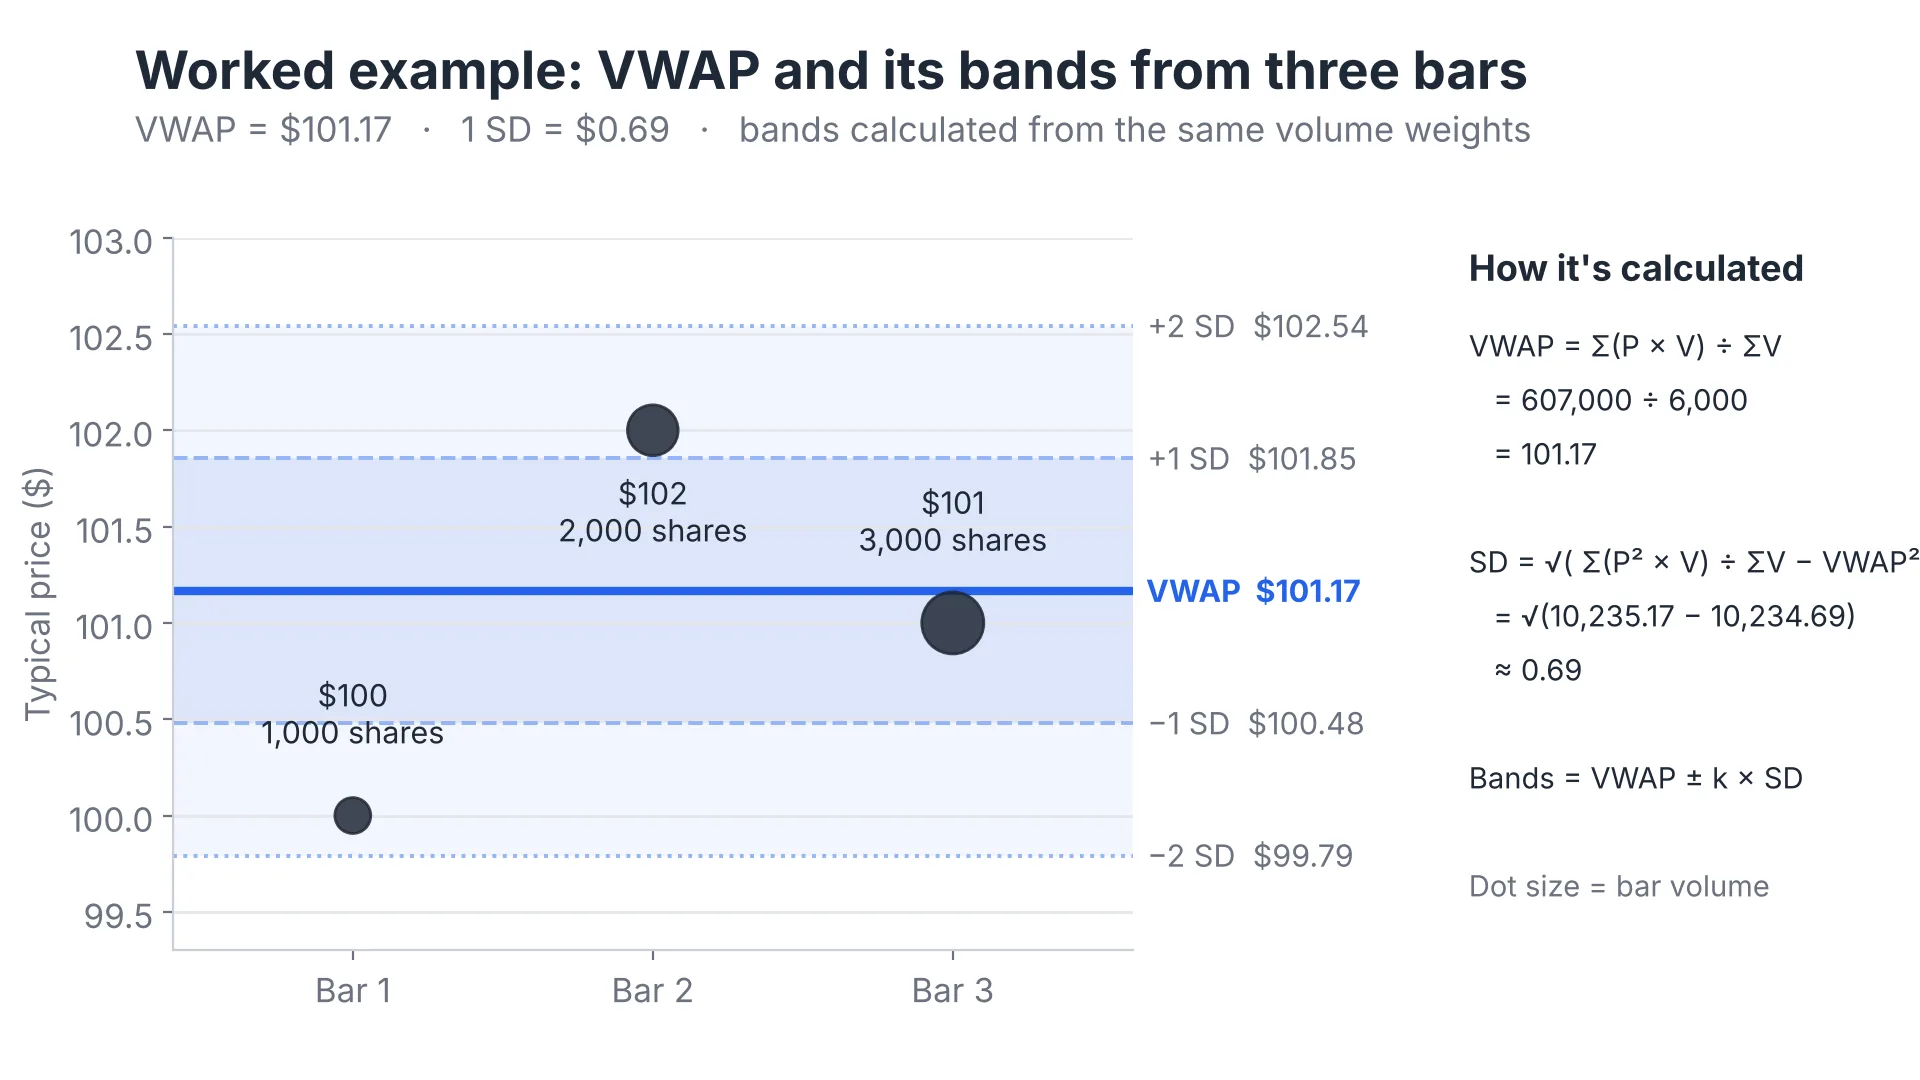
Consider three bars with the following prices and volumes:
| Bar | Typical Price | Volume |
|---|---|---|
| 1 | $100 | 1,000 |
| 2 | $102 | 2,000 |
| 3 | $101 | 3,000 |
The calculation is:
(($100 × 1,000) + ($102 × 2,000) + ($101 × 3,000)) ÷ 6,000 = $101.17
The resulting VWAP is $101.17. Although the first bar traded at $100, it contributes less to the calculation because its volume was lower.
Unlike a moving average, VWAP does not have a conventional length setting like a 9-period EMA or 20-period moving average. Instead, traders adjust its anchor, price source and deviation bands.
Recommended VWAP Settings for Day Trading
Here are the most commonly used settings for intraday stock and futures trading.
| Setting | Recommended Value |
|---|---|
| Anchor | Session |
| Price source | HLC3 |
| Standard deviation bands | 1 and 2 SD (3 optional) |
| Chart timeframe | 5 minutes |
| Extended hours | Off for regular-session stocks |
Anchor Period
The anchor determines when VWAP begins accumulating price and volume data. Changing it can produce a very different line, even when every other setting is kept the same.
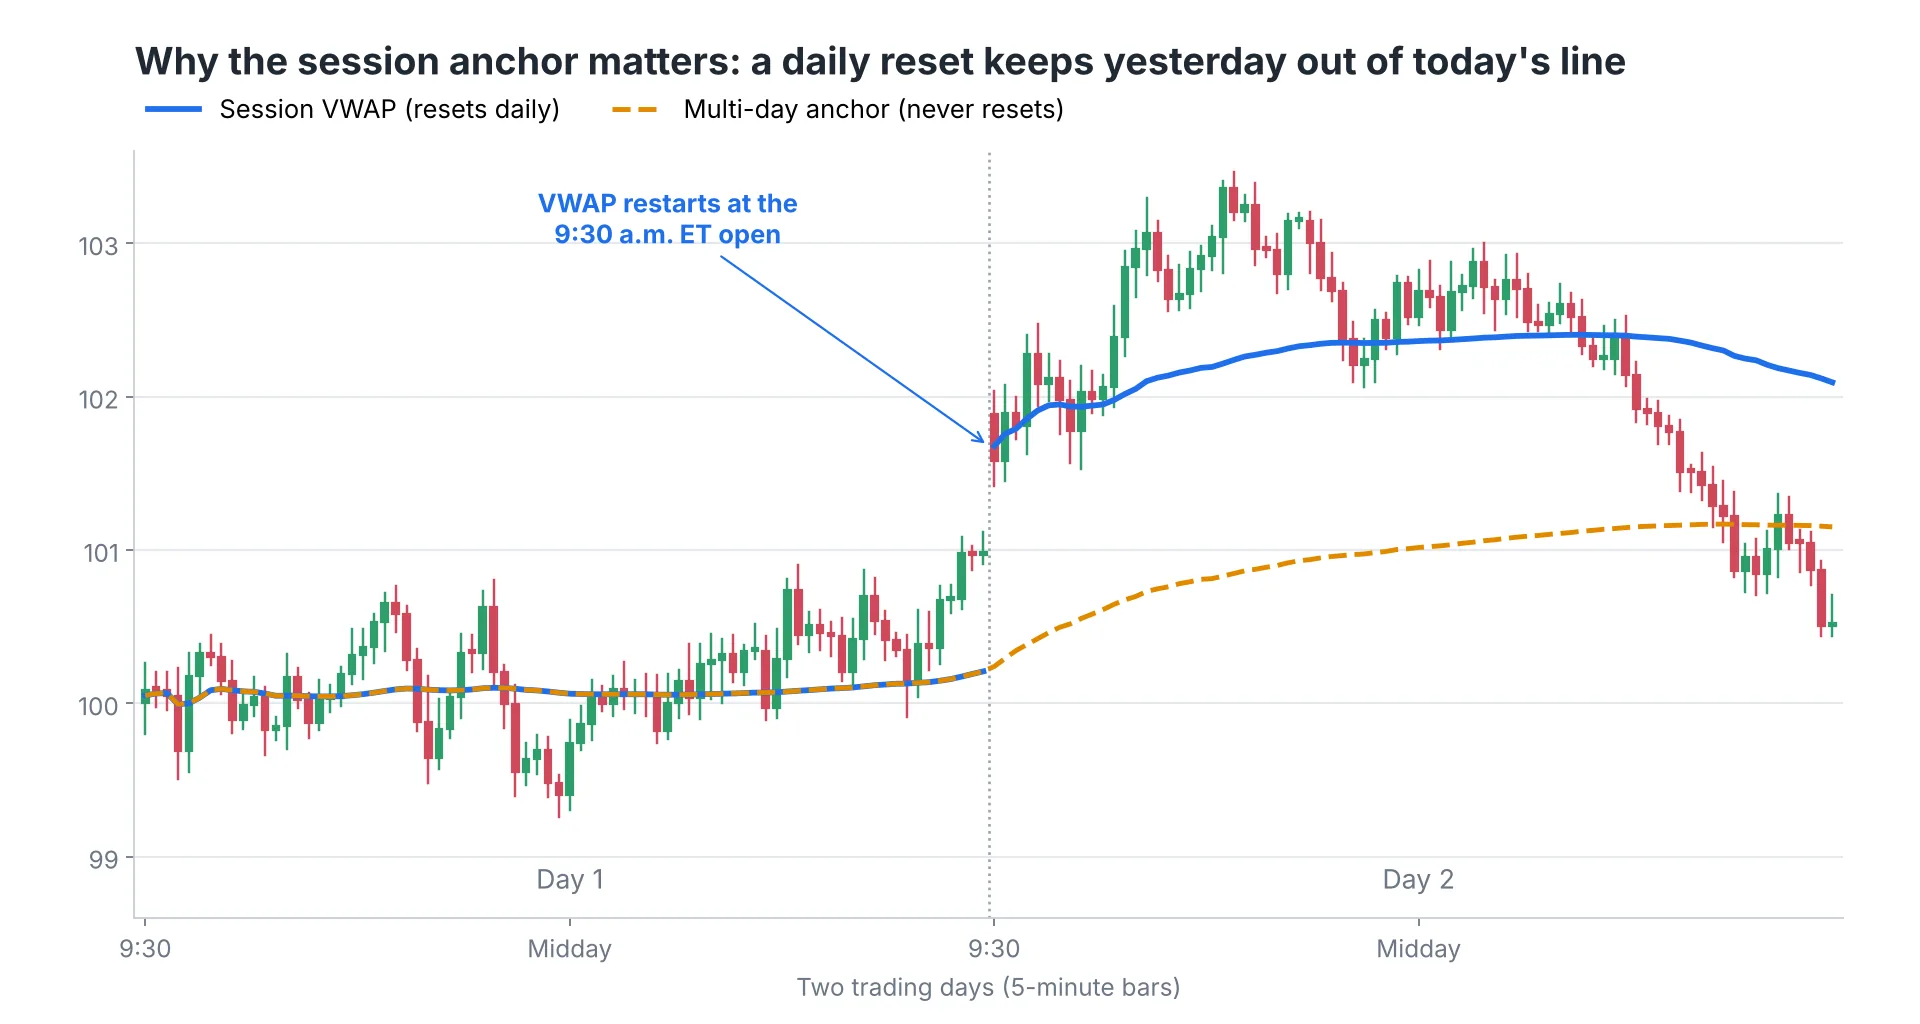
Session Anchor and the 9:30 ET Reset
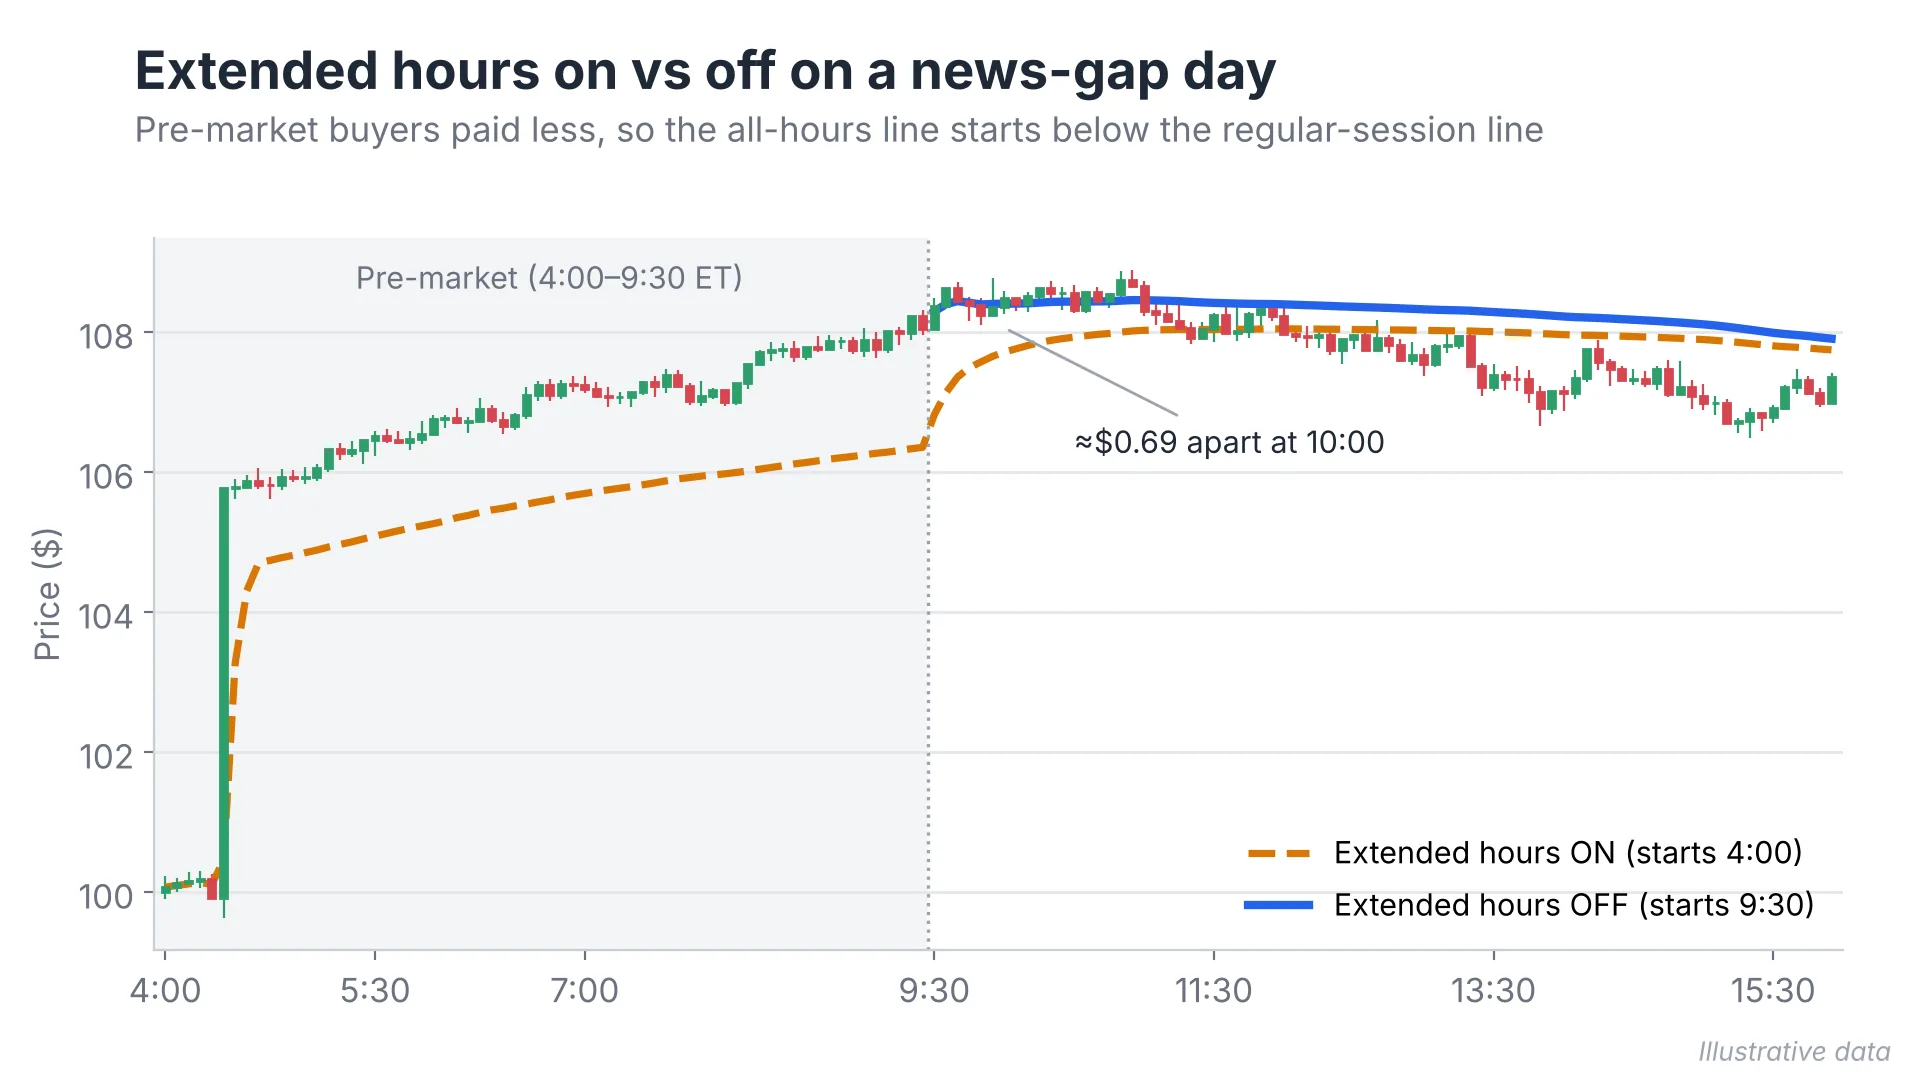
With extended-hours data disabled, session VWAP begins accumulating price and volume data at 9:30 a.m. ET, when the regular trading hours (RTH) session for US stocks opens. If extended-hours data is enabled, the calculation also includes pre-market trades, so VWAP starts building before the RTH session begins. The selected session determines which trades contribute to the VWAP calculation.
Including Pre-Market or Extended Hours
Pre-market trades often have lower volume than the regular session, although activity can increase around earnings releases and major news. Volume weighting limits their effect once regular trading starts, but they still tilt the line early on. Most day traders keep extended hours off so VWAP reflects regular trading hours (RTH).
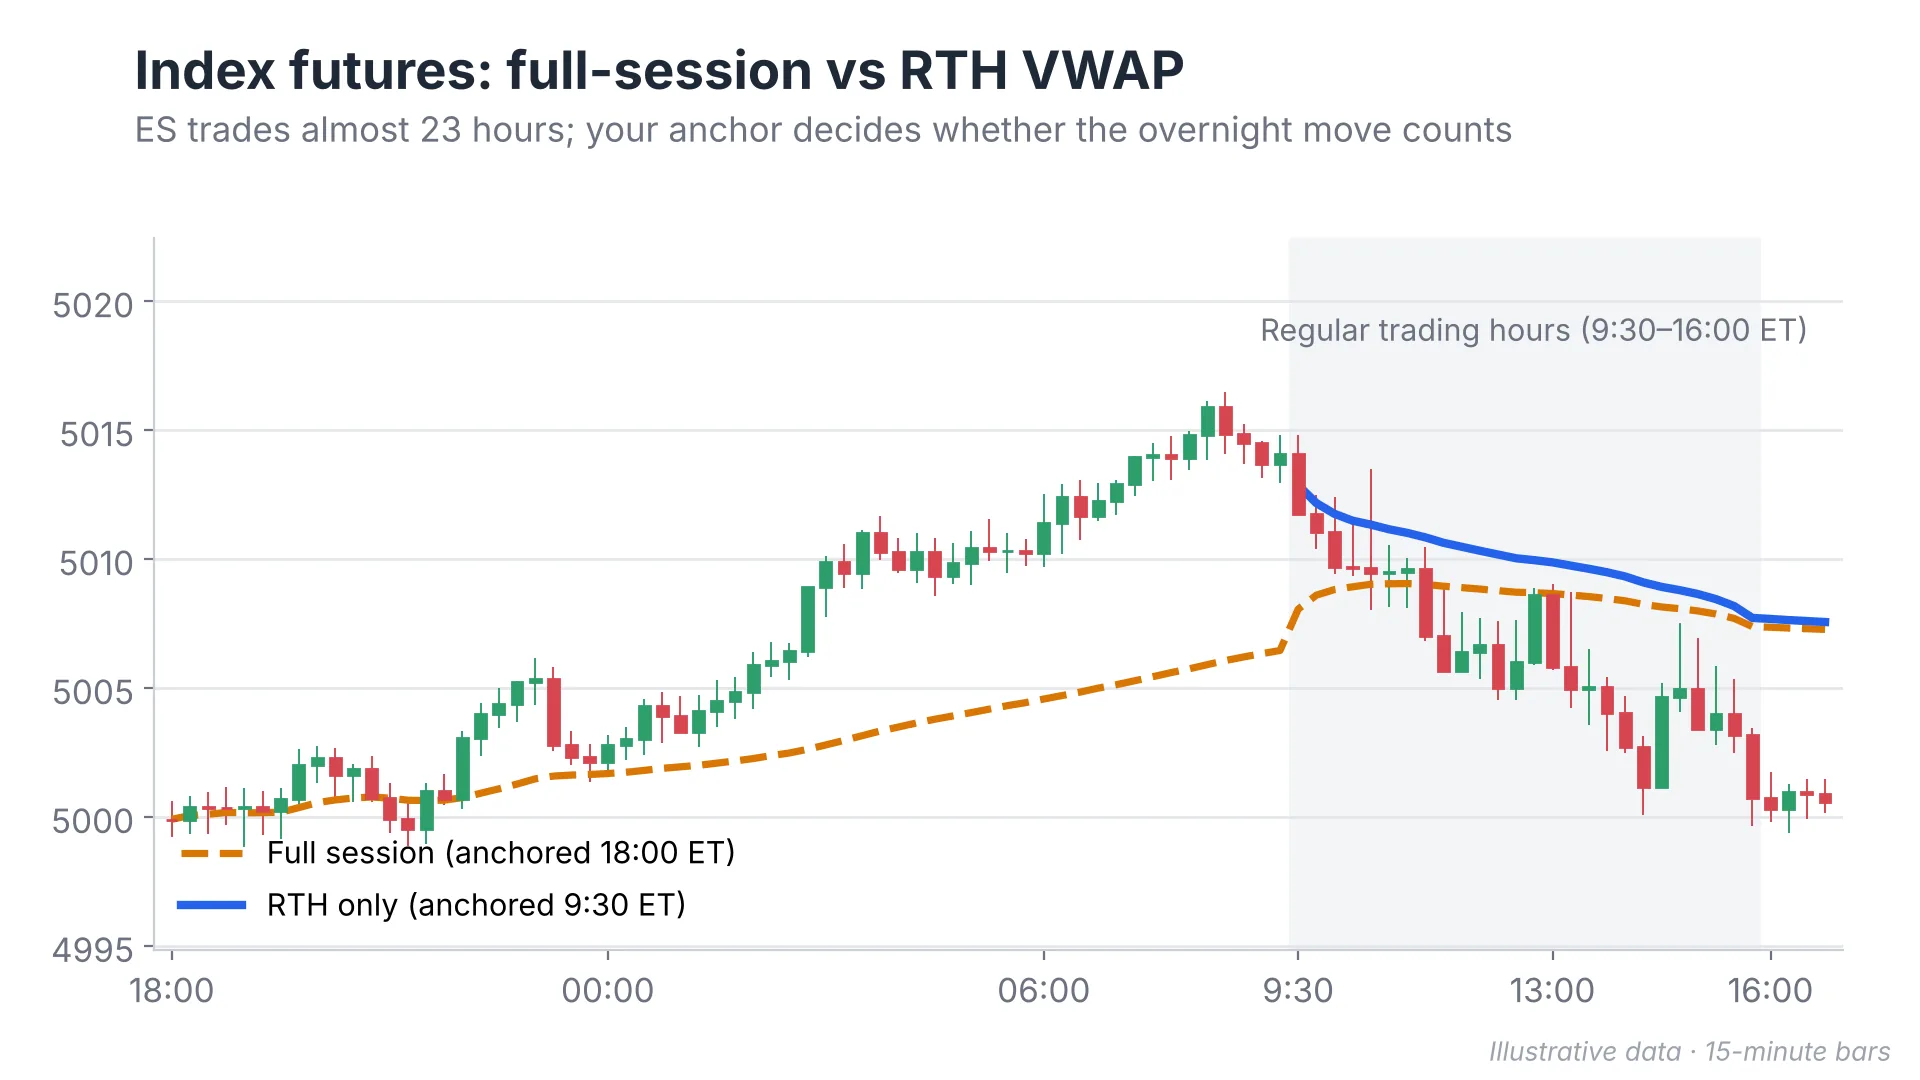
Futures traders need to account for different session hours. The 9:30 a.m. ET open applies to stocks, not all futures contracts. Depending on the contract, you can set VWAP to reset at the start of the RTH session or include the full trading session, including overnight activity.
TradingView and other charting platforms allow traders to include or exclude extended-hours data, depending on the instrument and indicator settings.
Why Weekly and Monthly Anchors Don't Fit Day Trades
Weekly and monthly VWAP carry price and volume data across multiple trading sessions. These anchors can help swing traders assess where an asset has traded relative to its longer-term volume-weighted average.
They aren’t as useful for studying, buying, and selling activity within a single day. For intraday setups, session VWAP gives a much clearer reference to the current day's activity.
Anchored VWAP for Gap and Earnings Days
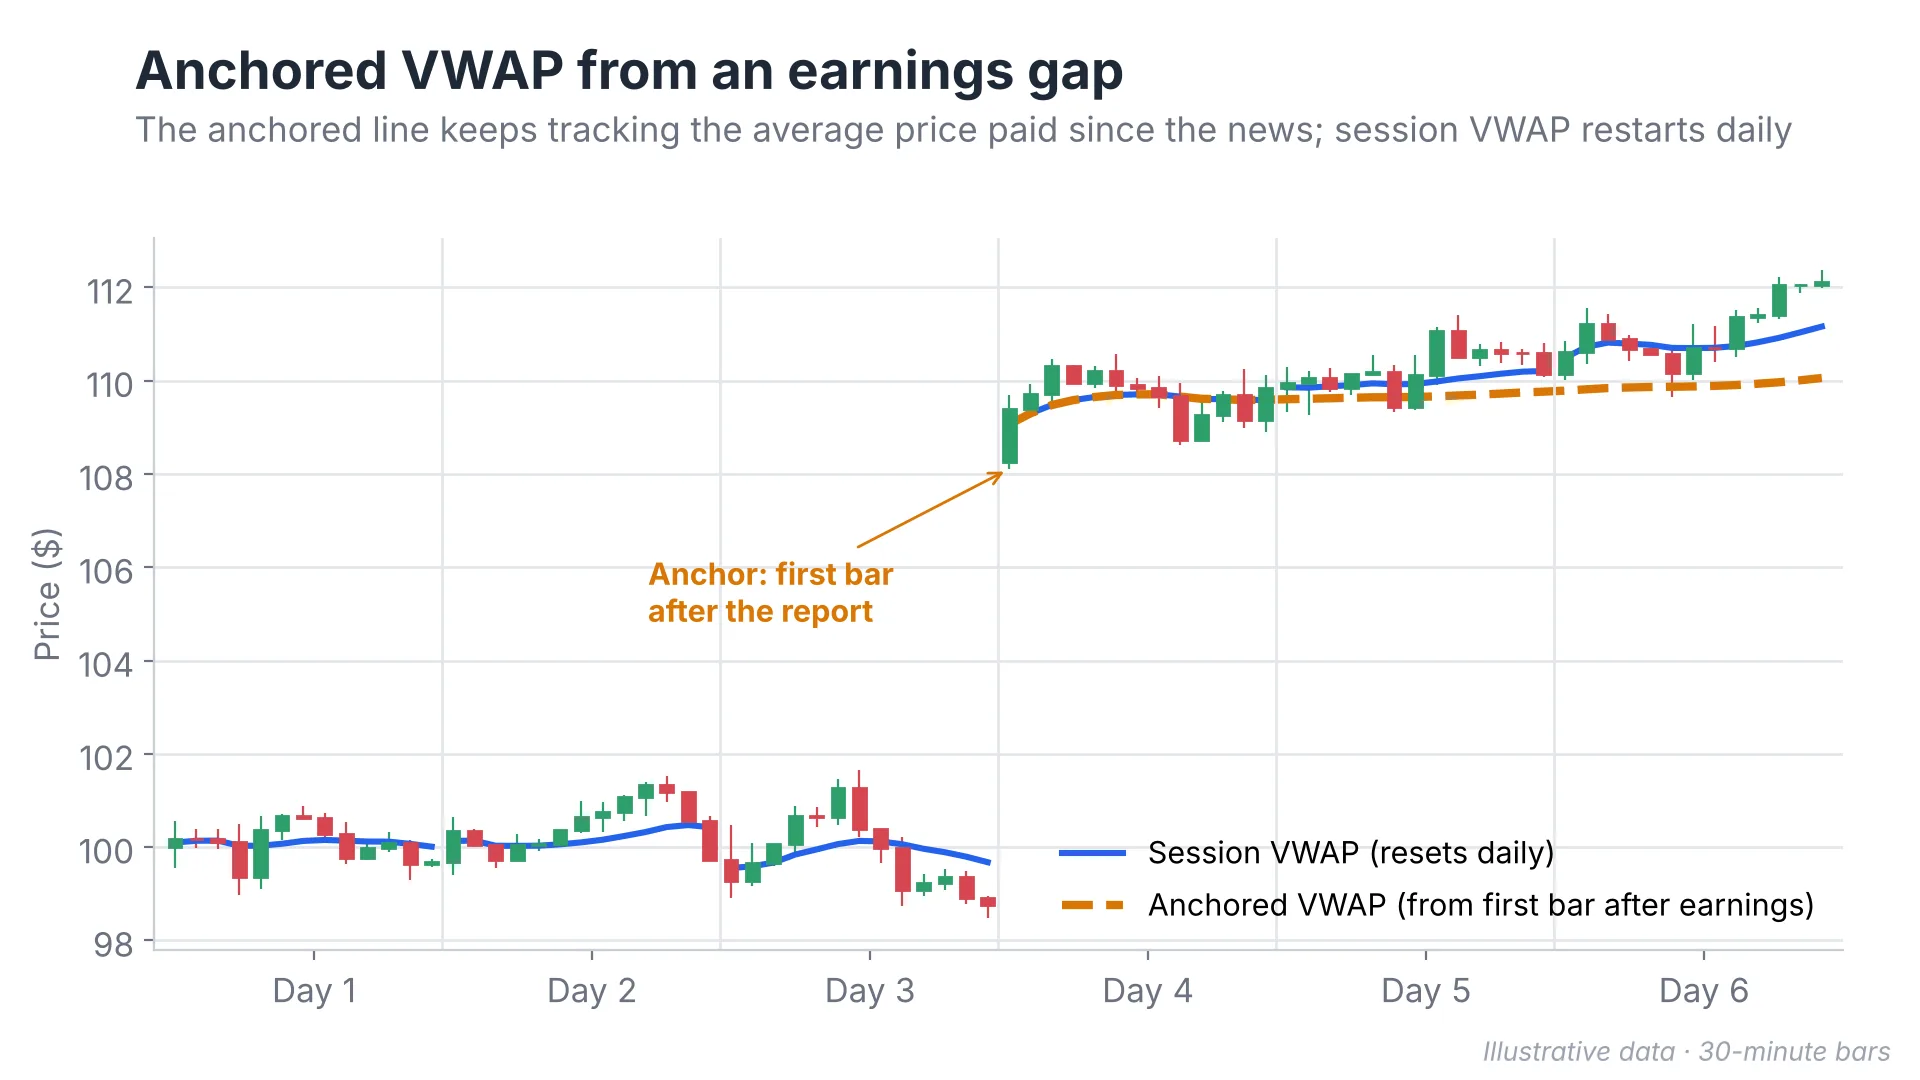
Anchored VWAP is different from the standard session calculation because it lets you choose the point where accumulation starts, so the line shows the average price since the news. For example, after a company releases earnings and its stock opens with a large gap, a trader can anchor VWAP to the event or the first trading bar after the announcement.
Price Source: HLC3, HL2 or Close
The price source tells VWAP which price to use for each bar.
Three common options are:
- HLC3: The average of the high, low and close. This is the default on many platforms and accounts for the full candle.
- HL2: The average of only the high and low, without the closing price.
- Close: Uses only the final traded price of each candle.
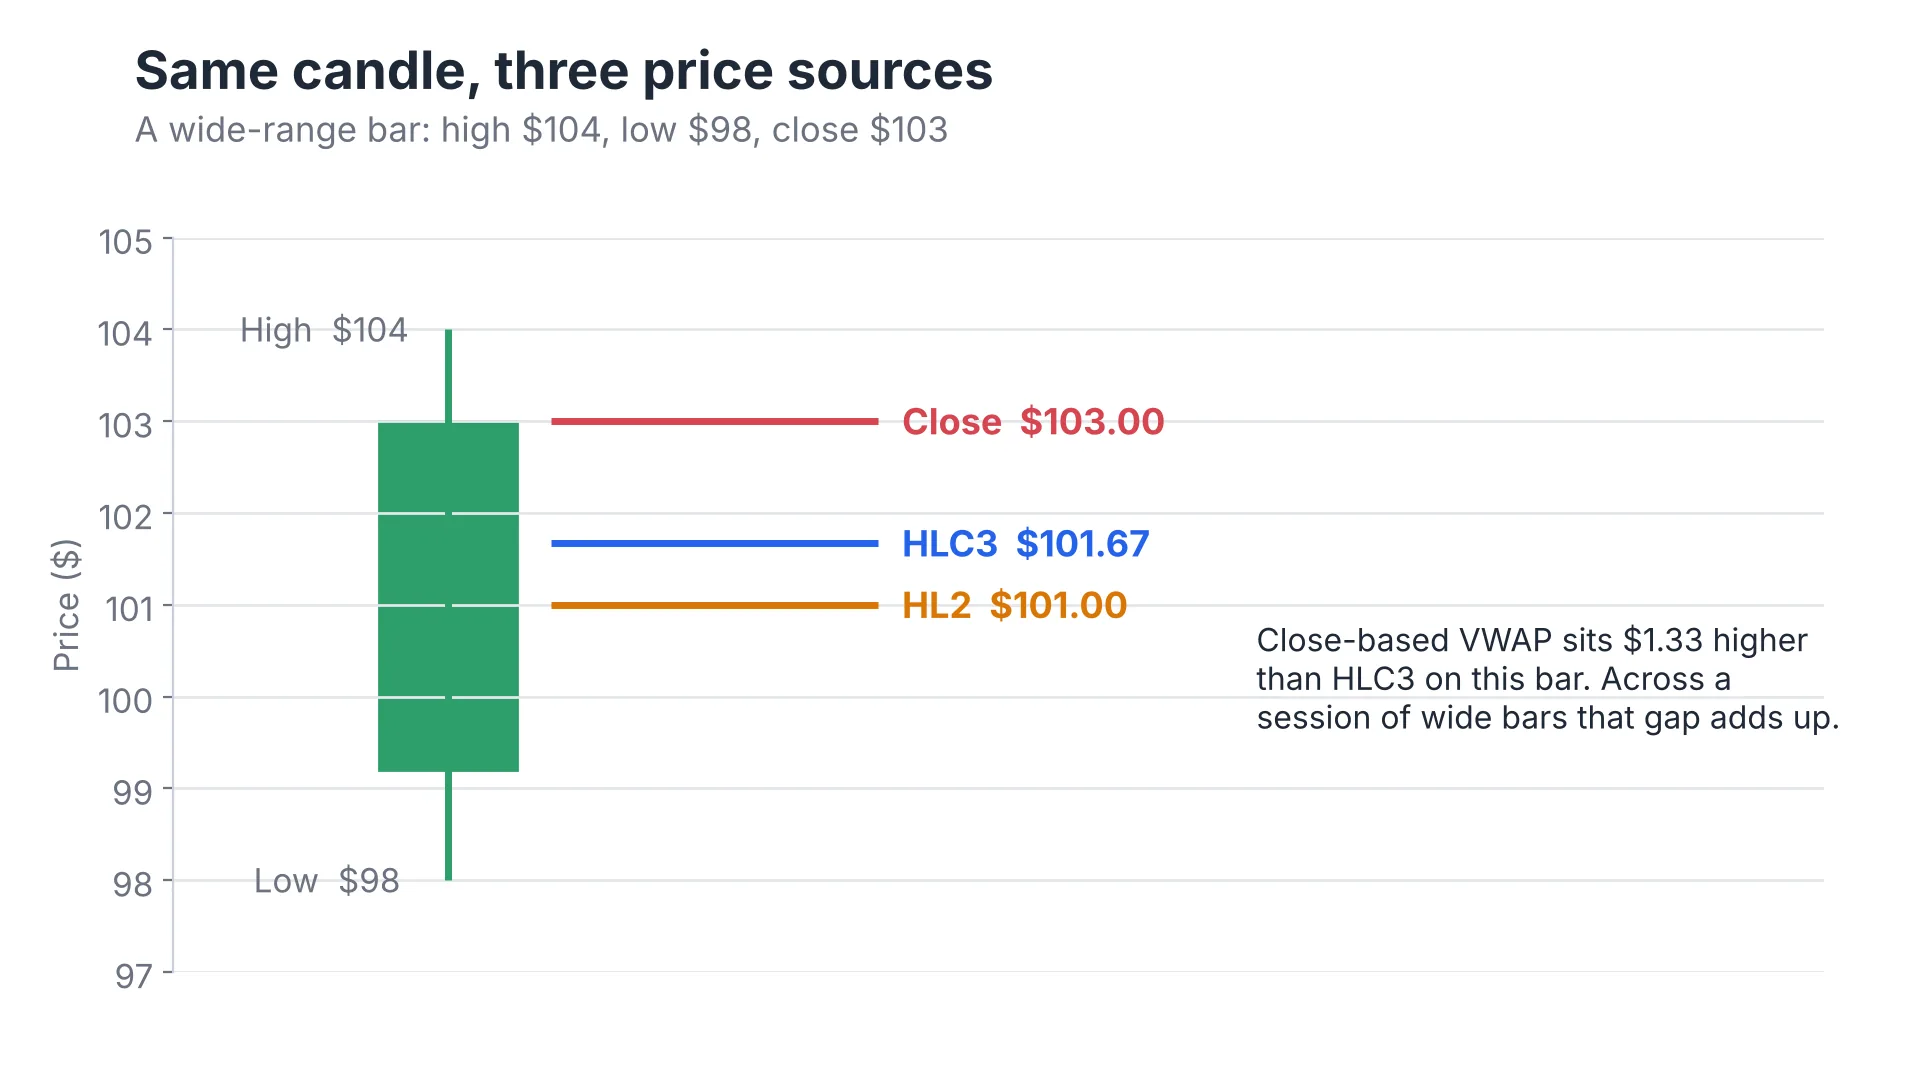
The differences become more noticeable when candles have wide ranges. For example, a stock might trade between $98 and $104 but close at $103. HLC3 would use $101.67, while Close would use $103.
HLC3 is a common choice because it accounts for more of the price action within each bar.
Standard Deviation Bands
VWAP bands give traders an idea of how far price has moved from the session average. They appear on either side of the VWAP line, with wider bands marking larger price deviations.
What the 1, 2, and 3 SD Bands Show
VWAP indicators typically offer three band levels, measured in standard deviations (SD). Each band is VWAP plus or minus a multiple of the volume-weighted standard deviation of price since the anchor.
- 1 SD: The 1 SD bands sit closest to VWAP. Traders use these levels to monitor smaller price extensions and possible pullbacks.
- 2 SD: These bands mark a wider move away from the average. They are often watched during range-bound sessions when traders look for price to return towards VWAP.
- 3 SD: The 3 SD bands mark more extreme price movements. They are optional.
Standard Deviation vs Percentage Bands
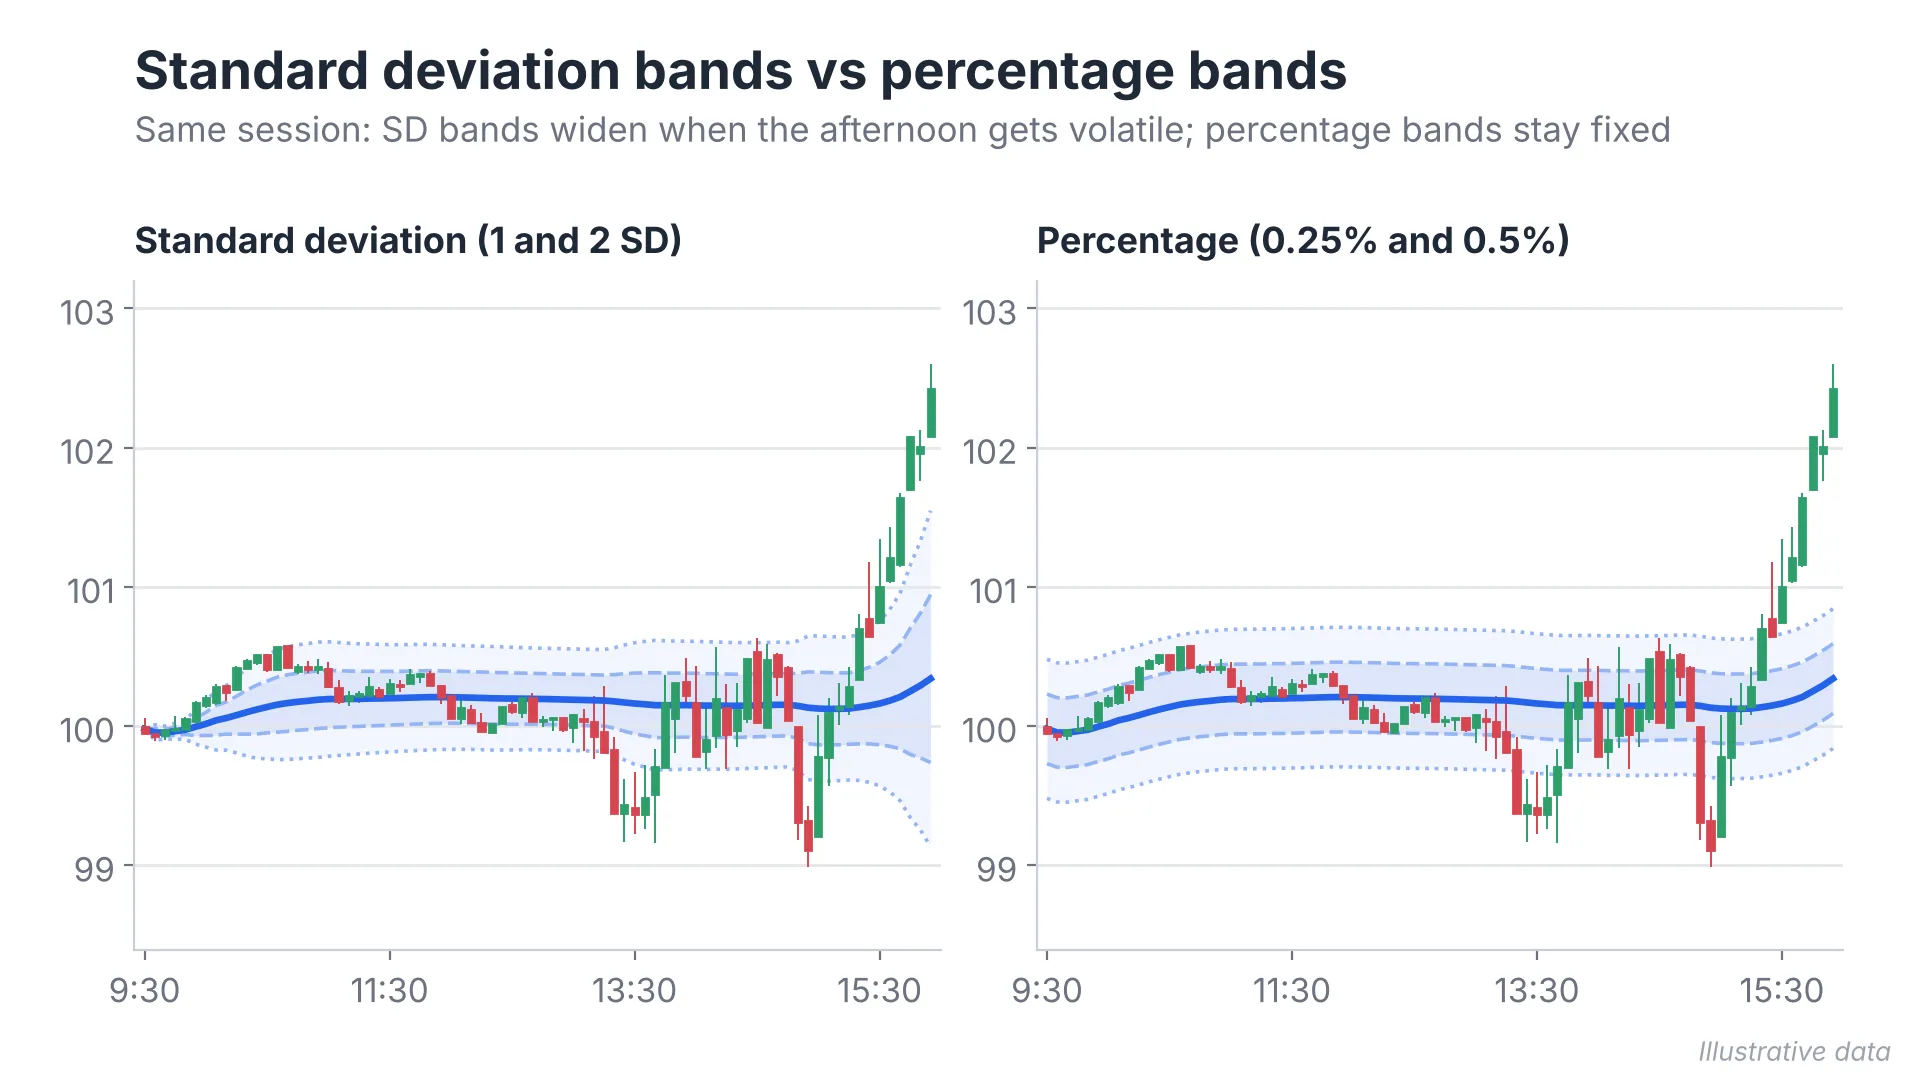
Percentage bands maintain a fixed distance from VWAP. If the selected percentage is 1% and VWAP is $100, the upper and lower bands will be $101 and $99.
For standard deviation bands, the distance changes with observed price variation. When intraday price movements become wider, the bands can spread out. During quieter periods, they can move closer together.
Best Chart Timeframe for VWAP
VWAP readings should be broadly similar across 1-, 5-, and 15-minute charts when the same session and data feed are used. However, small differences can occur because platforms may calculate VWAP using the OHLCV values of each chart bar. Changing the chart timeframe can affect the calculation.
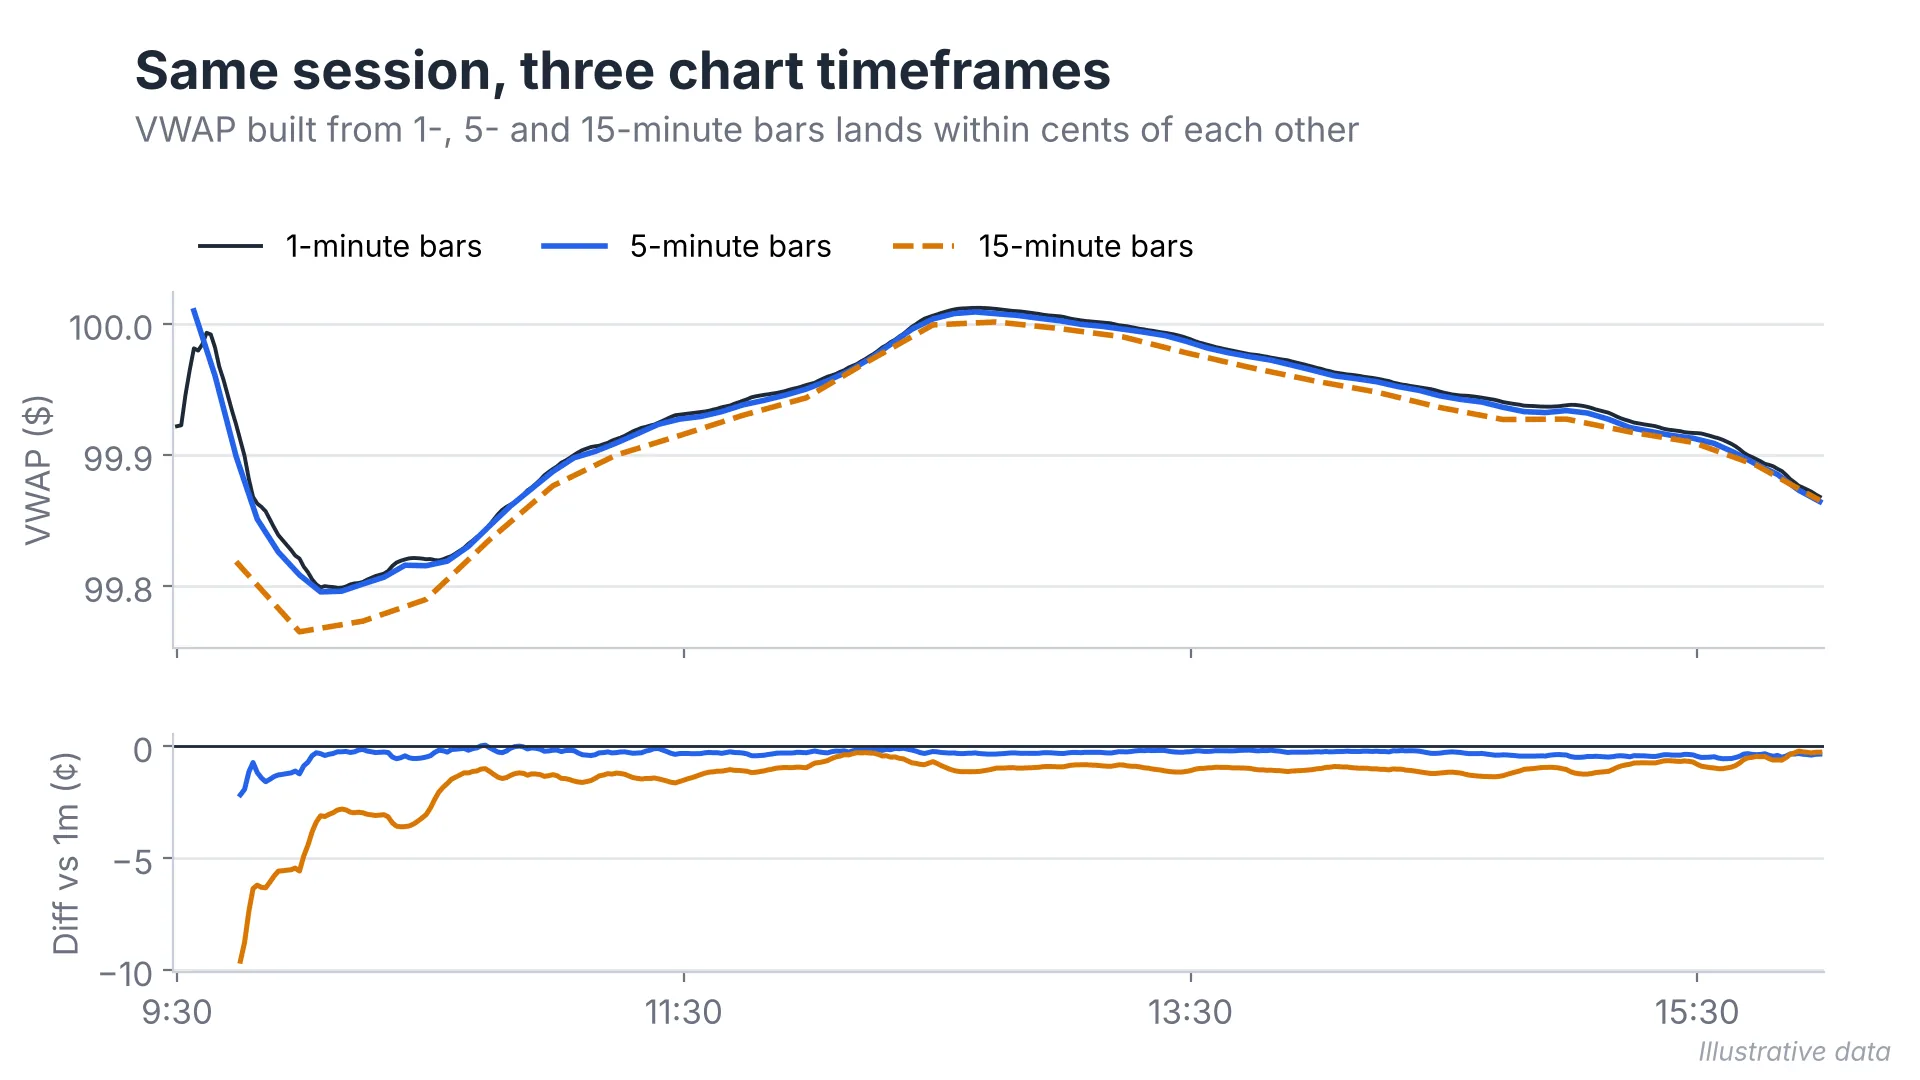
The 5-minute chart gives traders enough detail to follow price movements and identify pullbacks without the constant fluctuations that can make a 1-minute chart difficult to read.
Scalpers may prefer the 1-minute chart because it shows smaller price movements and allows them to monitor price more closely. The 15-minute chart suits traders who hold positions longer and want to focus on broader intraday moves.
The timeframe should reflect how you trade. You do not need to change the VWAP anchor every time you switch charts. Use the same data feed, session, and price source to get consistent readings.
VWAP Setting Presets by Setup
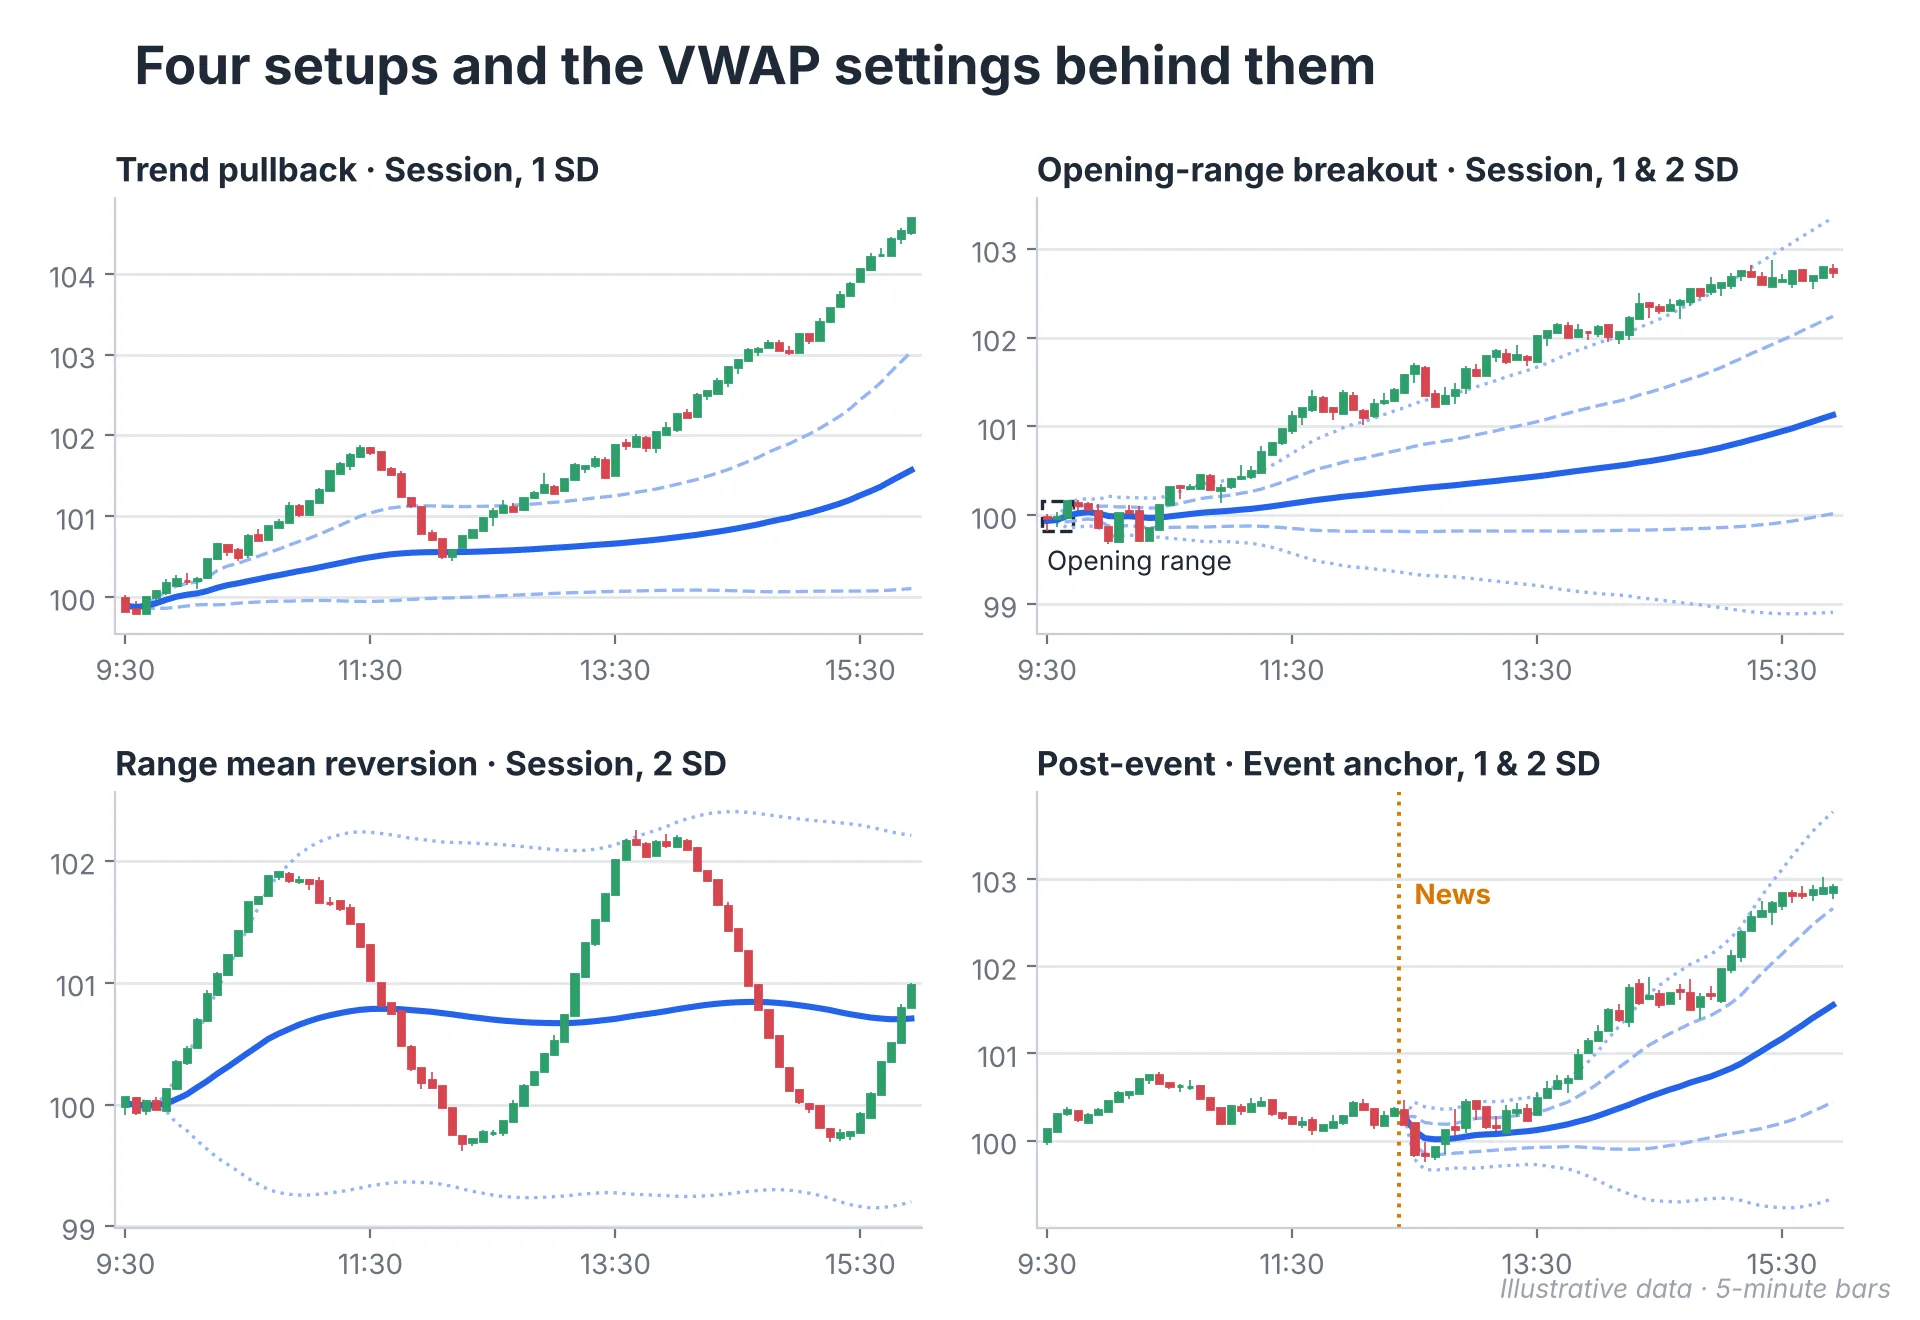
Here are some VWAP settings examples for day trading. These aren’t fixed rules, so test different bands to see what works best for your strategy.
| Trading setup | Anchor | Bands | What to monitor |
|---|---|---|---|
| Trend pullback | Session | 1 SD | Pullbacks towards VWAP or the inner band |
| Opening-range breakout | Session | 1 and 2 SD | Breakout strength and price extension |
| Range mean reversion | Session | 2 SD, with 3 SD optional | Whether price returns towards VWAP after an extended move |
| Post-event trading | Event | 1 and 2 SD | Price movement relative to VWAP since the announcement |
VWAP Settings by Market
VWAP relies on price and volume data, but that data is recorded differently across markets.
- Stocks: Session VWAP with extended hours disabled is suitable for traders focusing on the regular US trading session.
- Index futures: Traders can use regular trading hours (RTH) VWAP to follow the main US session or full-session VWAP to include overnight trading.
- Crypto: Cryptocurrency trades around the clock. Some traders reset VWAP at midnight UTC, while others use a different daily or event-based anchor.
- Forex: Spot forex has no centralized exchange volume. Trading platforms generally use tick volume, which counts price updates instead of the actual amount traded.
- Stock indexes: Indexes like the S&P 500 are calculated from their constituent stocks and do not have their own directly traded volume. Traders instead use VWAP on related instruments such as ES futures or SPY.
Reading VWAP Once It's on Your Chart
Price Position and VWAP Slope
Where price is relative to VWAP shows which side has had more control during the session. Trading above VWAP suggests buyers have been more aggressive, while trading below it points to stronger selling pressure.
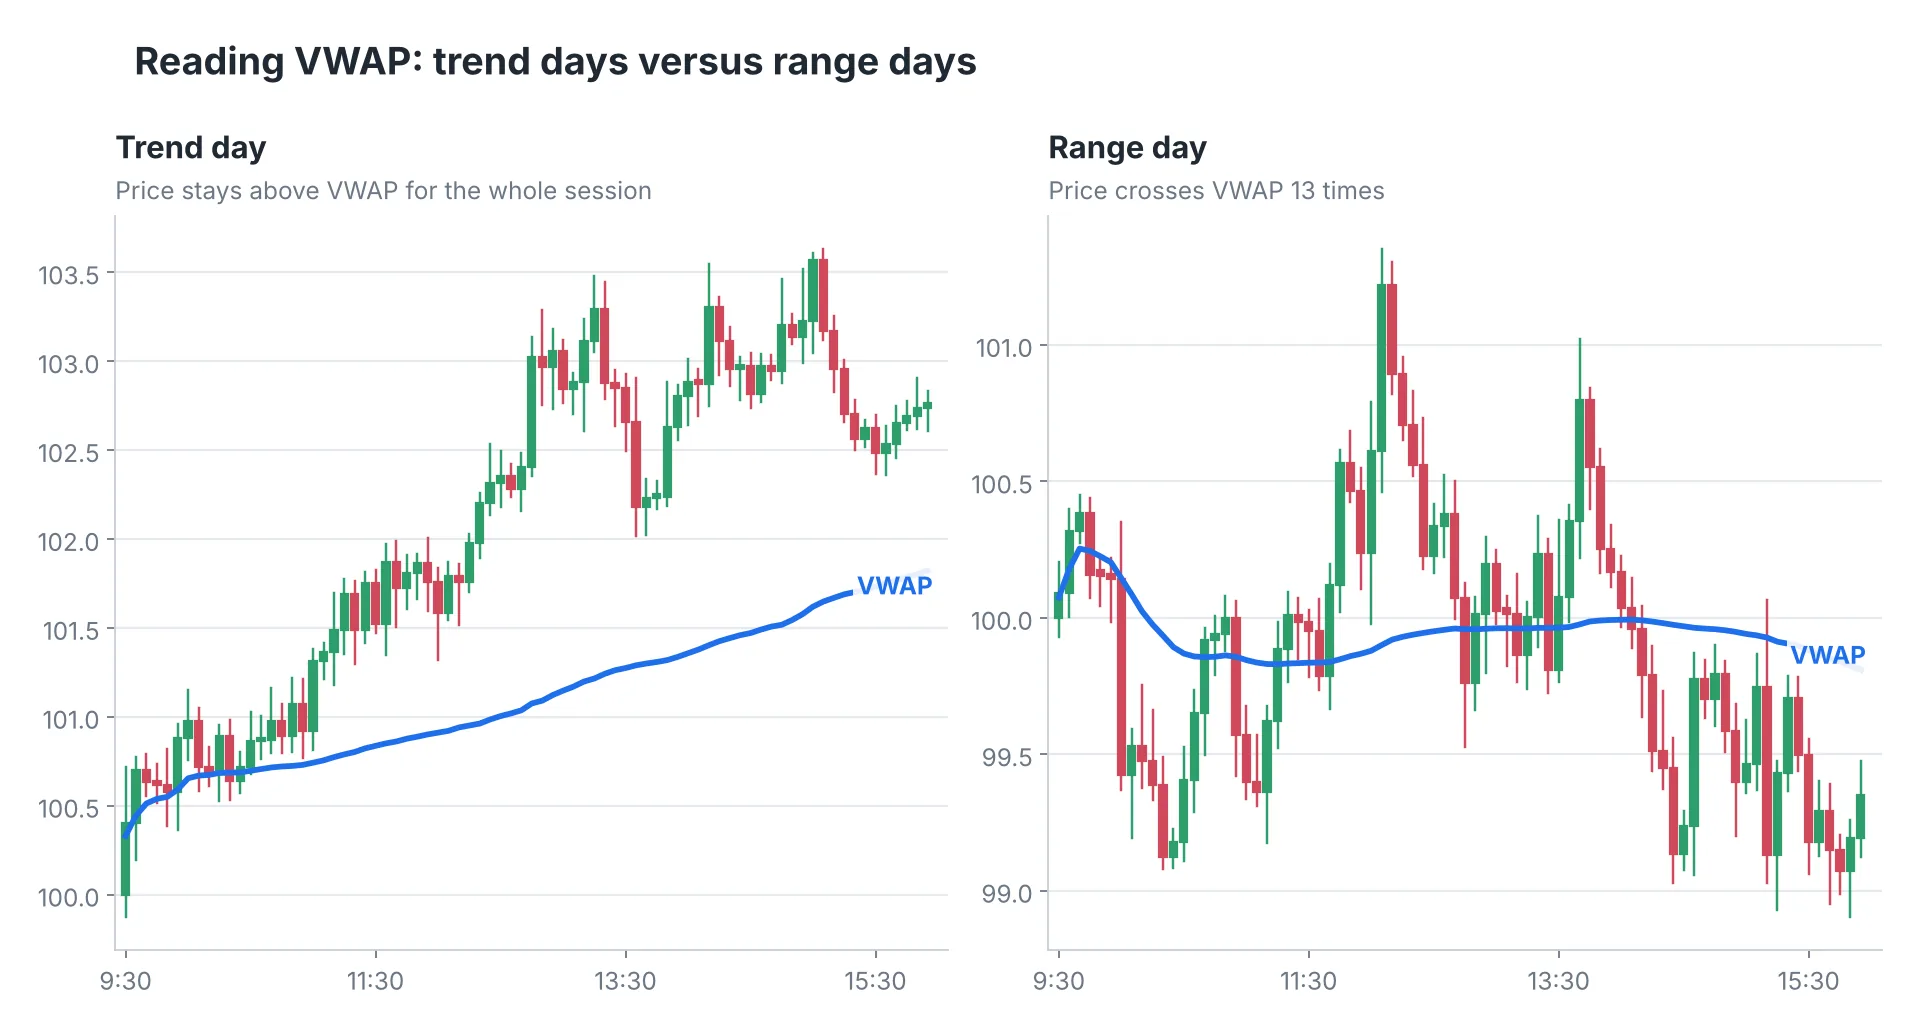
The direction of the VWAP line also adds more context. When price holds above a rising VWAP, it suggests an upward intraday trend. If price goes above a flat VWAP but keeps crossing back towards it, the market may not have a clear direction. A falling VWAP with price below it points to a downtrend.
Why Early-Session VWAP Is Unreliable
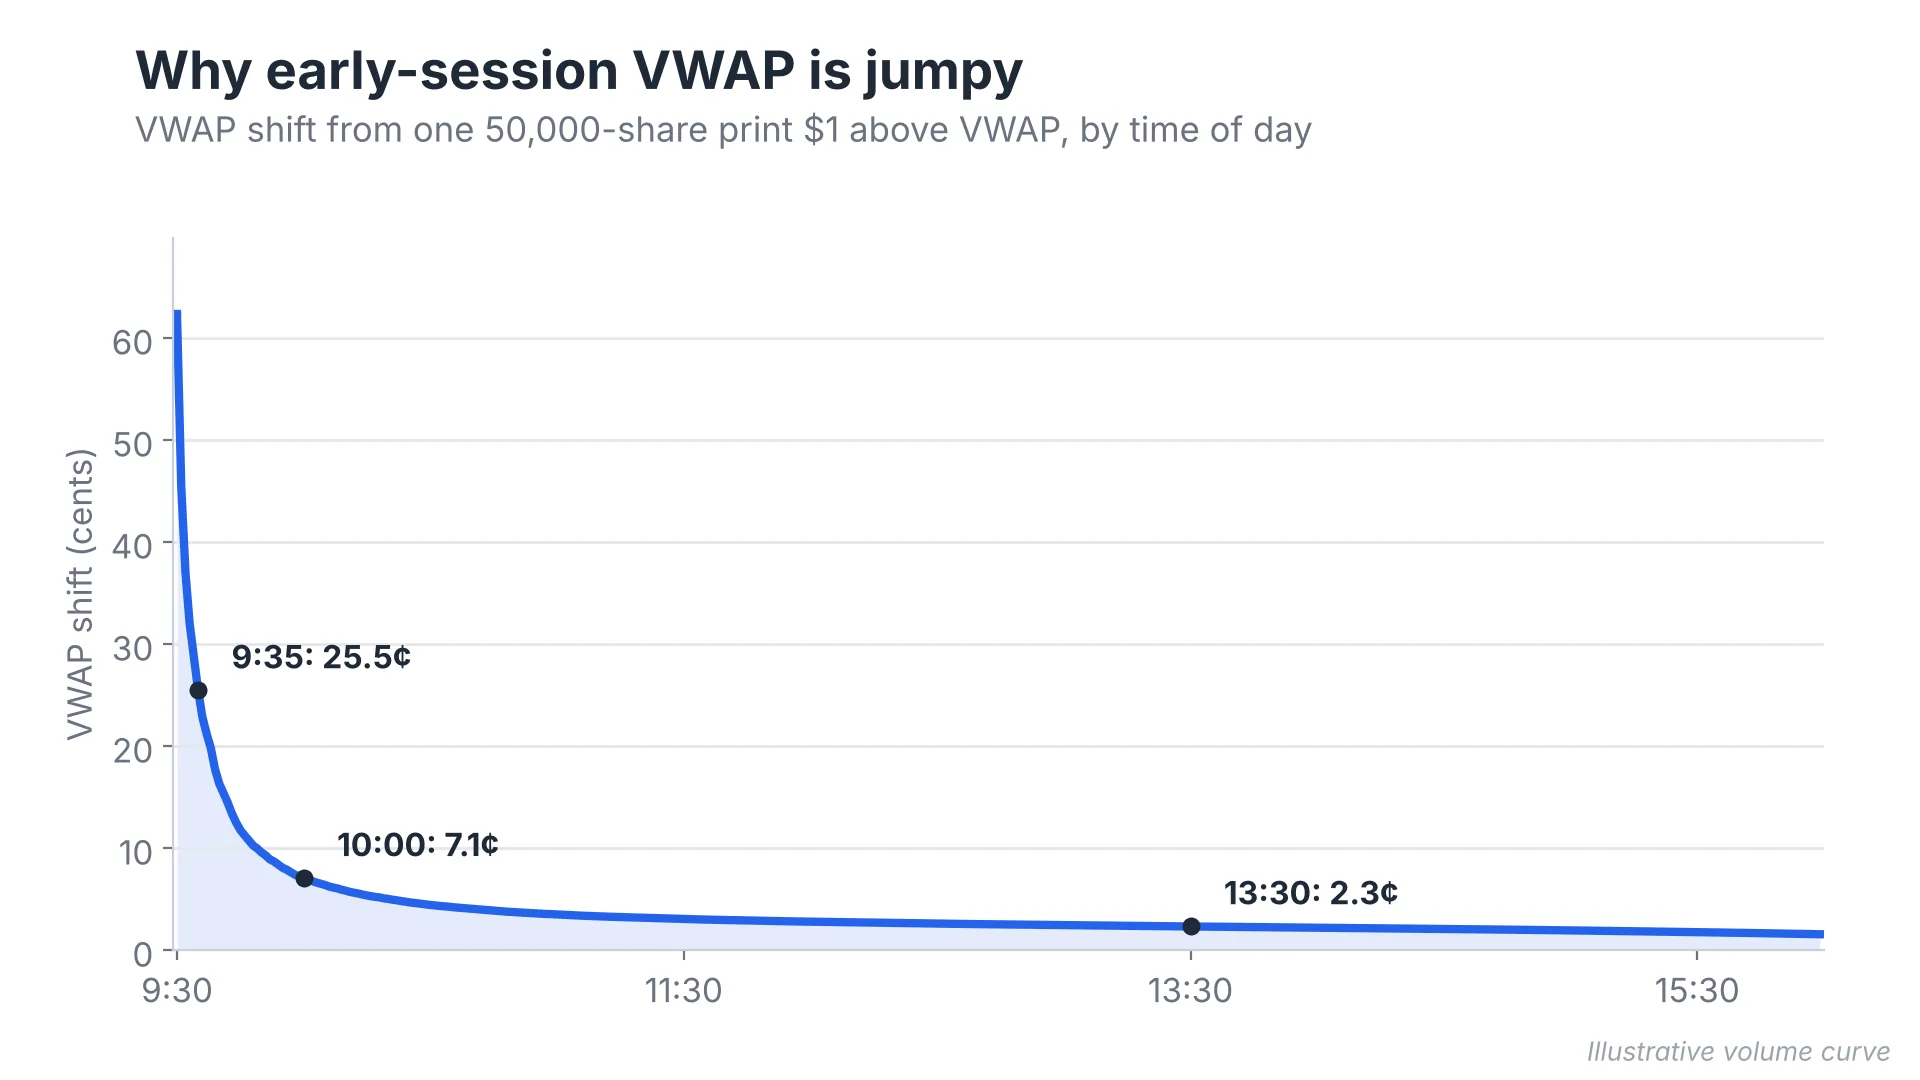
VWAP can move sharply during the opening minutes, particularly when large orders enter the market. At this point, relatively little volume has accumulated, so new transactions have a bigger effect on the average.
As the session progresses and more volume comes in, the calculation becomes less sensitive to individual trades.
Trend Days vs Range Days
On a trend day, price often stays on one side of VWAP for much of the session. In an upward trend, for example, pullbacks towards the line may attract buyers before price continues higher.
Range-bound sessions tend to produce more VWAP crossovers. Price moves above and below the line as neither buyers nor sellers maintain control for long.
Using These Settings in Day Trades
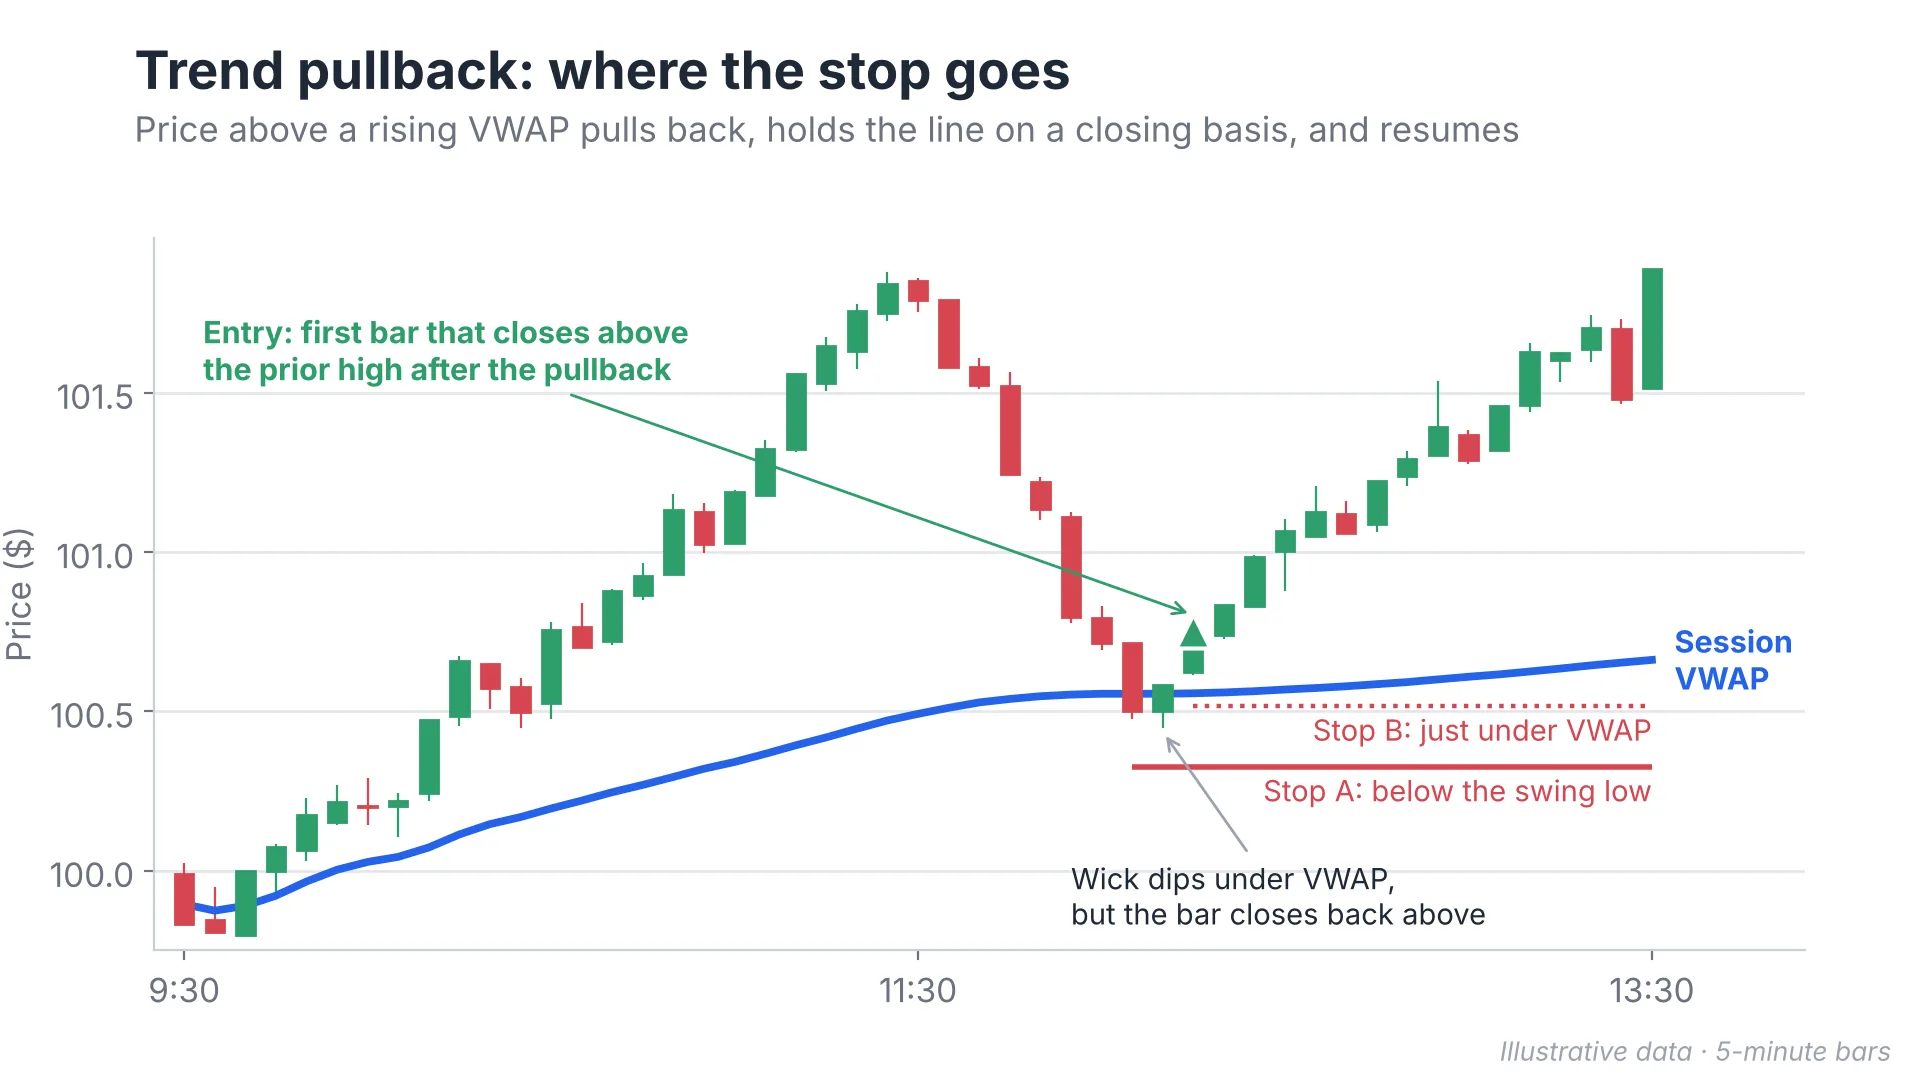
You can use VWAP to identify pullbacks, confirm a reclaim or spot price extensions. When price is above a rising VWAP, watch for a pullback towards the line. If price tests the area around VWAP and then moves back up, it may signal that buyers are stepping in and the uptrend could continue.
If price crosses back above VWAP after trading below it, wait for a retest. A hold above the line suggests buyers are regaining control.
In a range-bound session, the 2 SD bands help identify extended moves. Look for signs of rejection near an outer band before targeting a return towards VWAP.
Place your stop where the setup becomes invalid. For a pullback, this could be below the recent swing low. A stop just beyond VWAP may be too tight if normal price fluctuations reach the line.
Pairing VWAP With Other Indicators
VWAP provides a volume-weighted price reference, but other indicators can add information about momentum and trading activity.
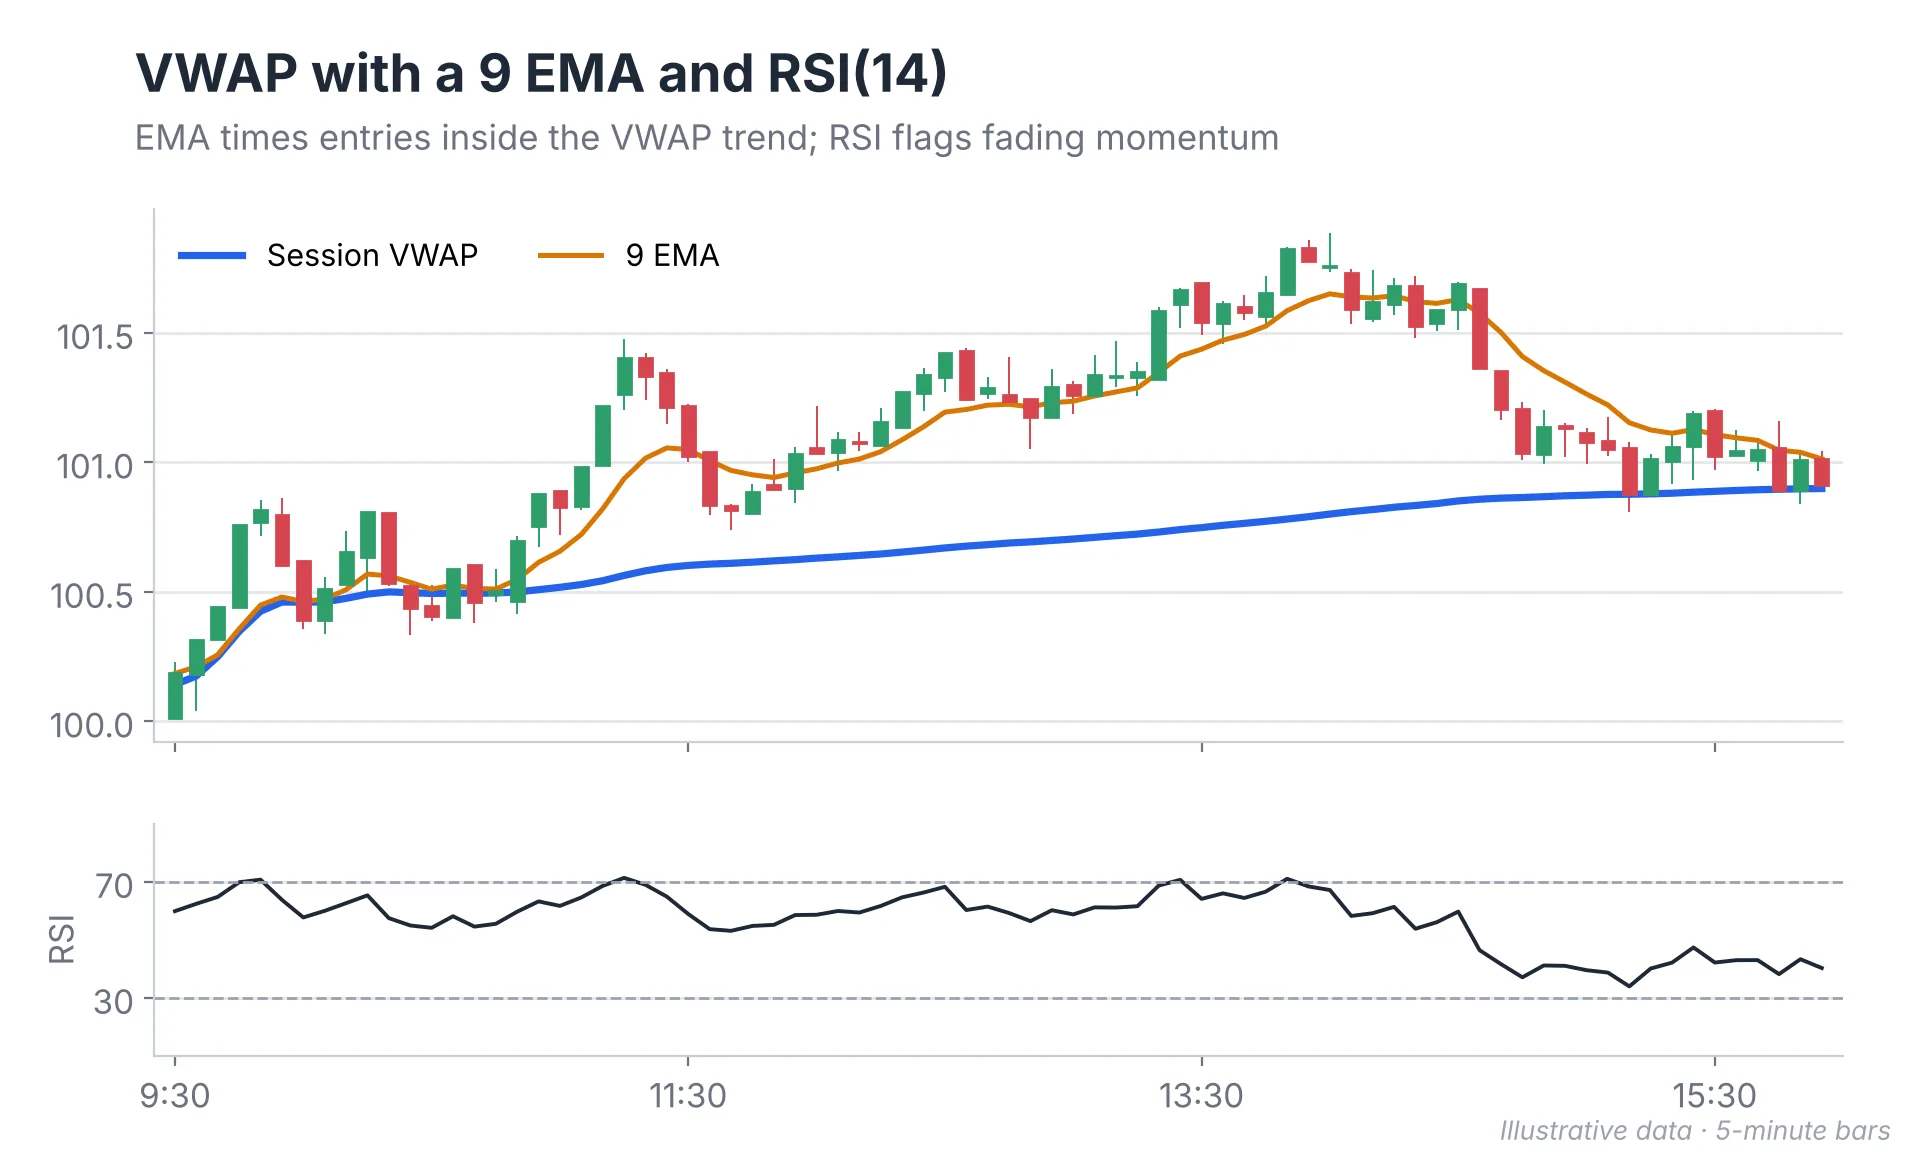
- 9 EMA: When price is above a rising 9 EMA and VWAP, the EMA points to short-term upward pressure and VWAP to buying across the broader session.
- RSI: RSI measures the speed and strength of recent price action. You can use it to check whether momentum supports a VWAP breakout or is weakening near an outer band.
- Volume Profile: Volume Profile shows where the market has traded the most volume. Its high-volume nodes can help identify areas where price may pause or consolidate around VWAP.
How to Test Your VWAP Settings
Changing several VWAP settings at once makes it difficult to tell which adjustment actually affected the results. Pick one market, keep the anchor and price source fixed, and write down the exact conditions for entering and exiting trades.
Divide your data into separate testing periods. Test the rules against historical data, then use a separate sample to see whether the results hold up. Include commissions, spreads and slippage, particularly if the strategy involves frequent entries and exits.
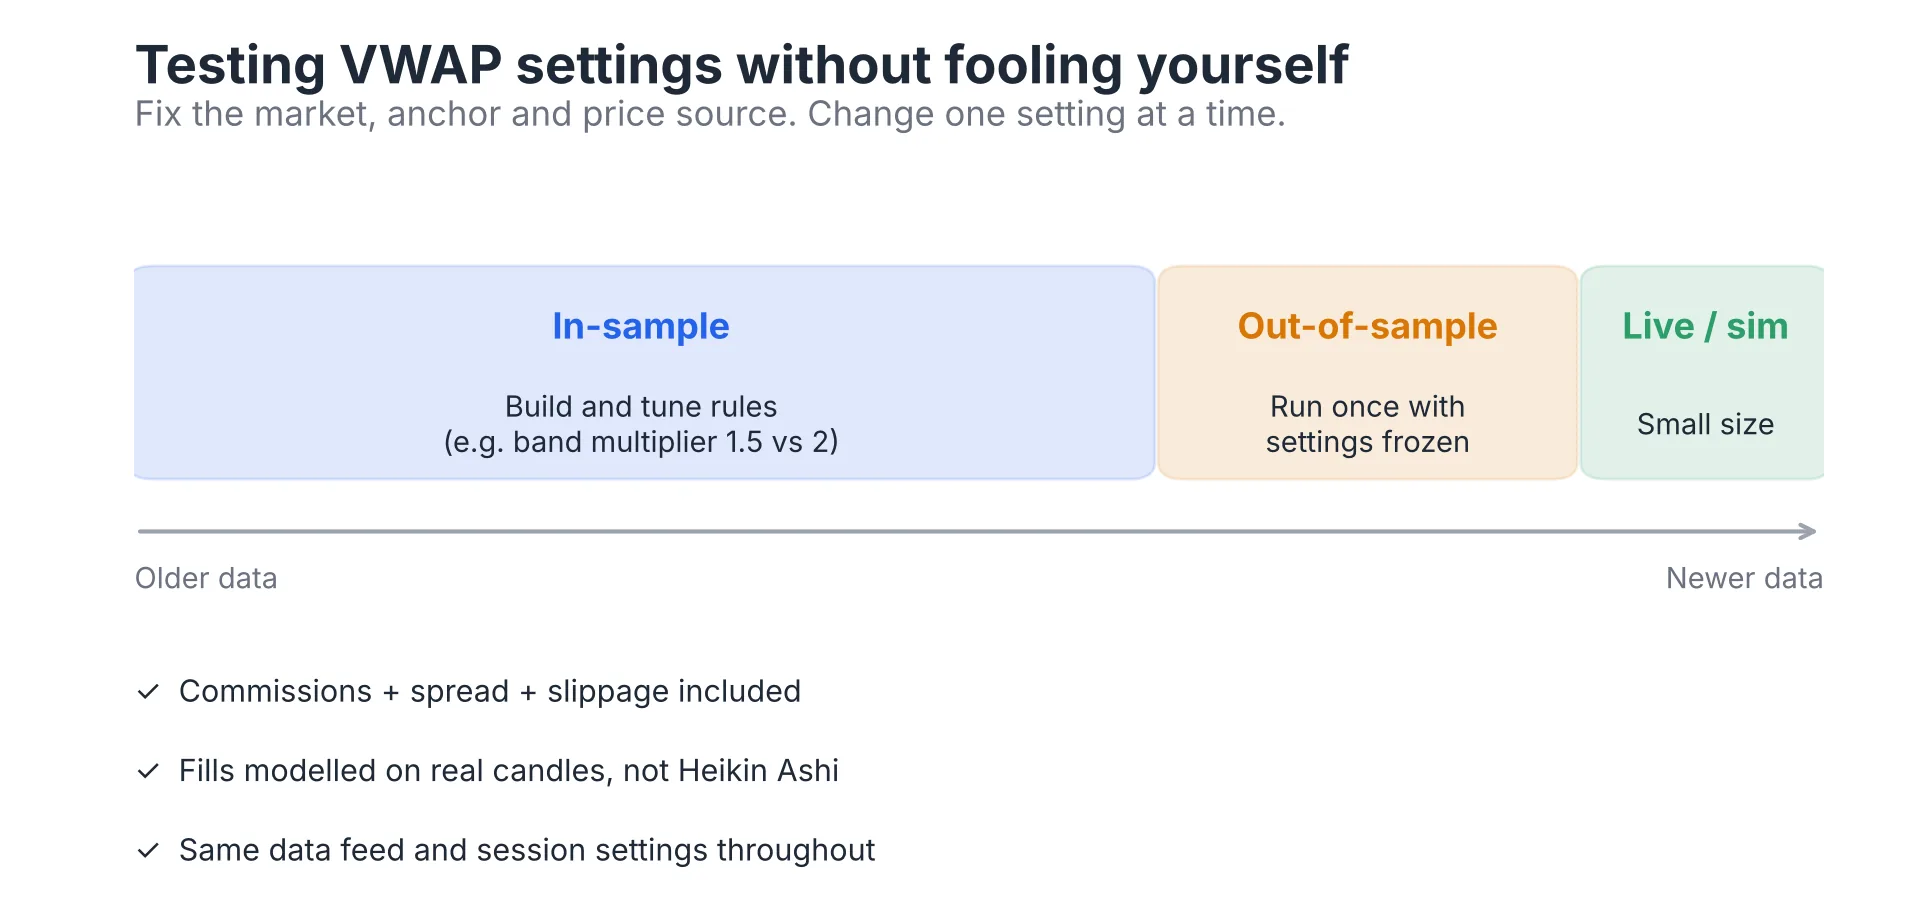
Use standard candlestick charts when testing entry and exit prices. Heikin Ashi candles use modified open, high, low, and close values based on current and previous candles. Their displayed prices may not match actual executable market prices, so use real market prices when modeling trade fills in a backtest.
Common VWAP Settings Mistakes
- Wrong reset time: Using the wrong session reset can shift the VWAP line and affect your analysis. For US stocks, resetting at midnight instead of 9:30 a.m. ET means the calculation won't reflect the regular trading hours (RTH) session alone.
- Using monthly anchors for day trades: A weekly or monthly anchor can also be misleading when you're analyzing a single trading session. Use a session anchor for intraday analysis unless your strategy specifically requires a longer reference period.
- Comparing different data feeds: Avoid comparing VWAP readings from different data feeds without checking their volume sources and session settings. Differences in these inputs can produce different values.
- Changing band multipliers too often: Changing standard deviation multipliers after every losing trade makes it difficult to evaluate a strategy. Keep the settings consistent during testing, then assess whether changes improve the results.
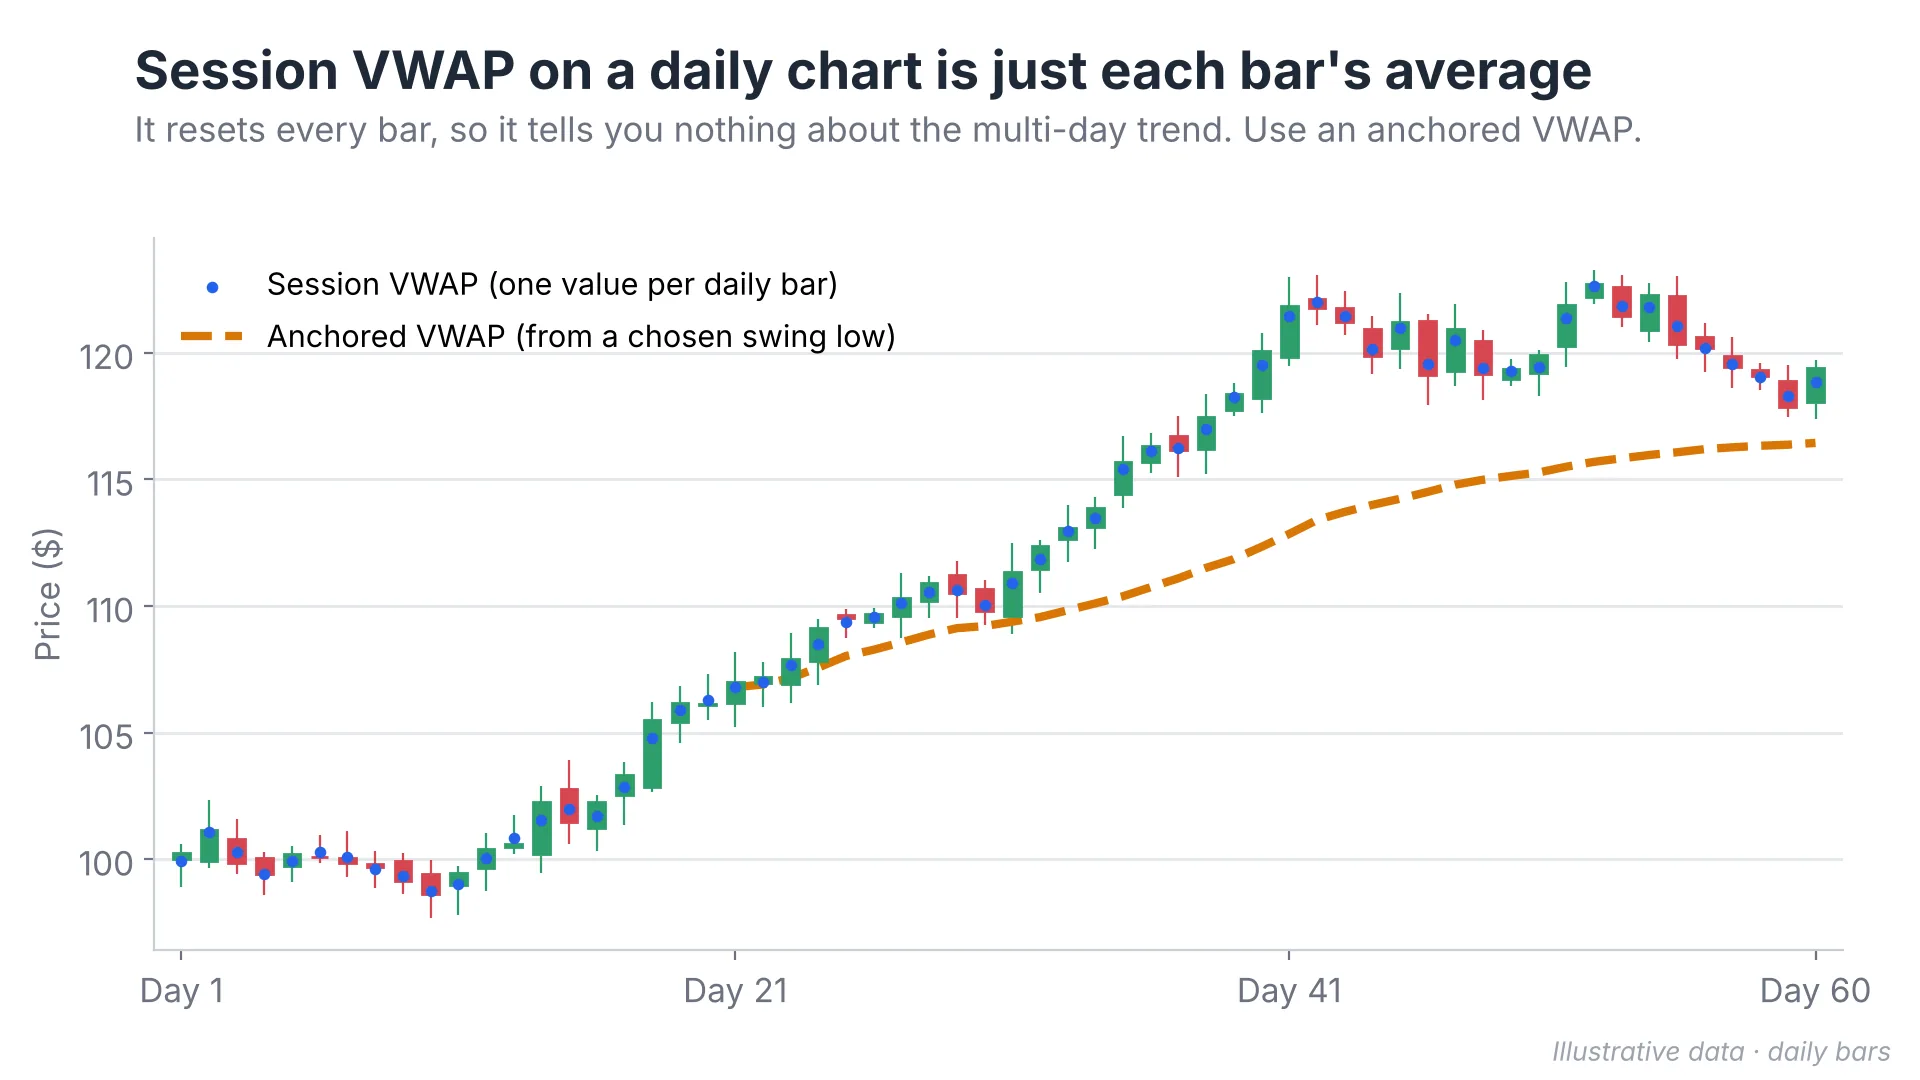
- Using session VWAP on daily charts: Session VWAP resets at the start of each trading session. On a daily chart, this means it resets on each daily bar instead of carrying its calculation across multiple days. For multi-day analysis, use a weekly, monthly, or manually anchored VWAP.
FAQs
Does VWAP have a period setting?
No. VWAP uses cumulative price and volume data from its selected anchor. Unlike a moving average, it doesn't calculate an average over a fixed number of candles.
Why do two platforms show different VWAP lines?
Platforms can show different VWAP values because they may use different data feeds, session hours, price sources, or volume calculations. Chart timeframe and bar aggregation can also affect the readings.
Does VWAP repaint?
VWAP changes throughout the session as new price and volume data arrive, so its value changes during an active candle. Once the session's data is complete, historical VWAP values generally remain the same.
Can you use VWAP on daily charts?
Yes, but session VWAP resets at the beginning of each trading day. On a daily chart, this means each bar starts a new calculation, which limits how useful it can be for multi-day analysis. An anchored VWAP or weekly VWAP is more suitable for analyzing price over longer periods.
Ready to take the next step? Explore AtlasFunded's prop trading programs today and put your trading skills to work with the capital to match.
Explore funding programs
 Senior Writer at Atlas Funded




 Your move
 Only pay the full fee after you pass

 UK
 ES
 DE
 FR
 IN
 IT