


The Relative Strength Index (RSI), Moving Average Convergence Divergence (MACD), Rate of Change (ROC), and Stochastic Oscillator are among the most widely used momentum indicators for day trading. Each measures price movement differently, helping traders assess buying and selling pressure, identify potential reversals, and confirm trends.
No single indicator works best in every market condition. The right choice depends on your strategy, timeframe, and the type of market you're trading. Combining a momentum indicator with VWAP, volume and price action can provide better context for intraday decisions.
What Is Momentum in Day Trading?
Momentum measures how quickly an asset's price changes over a specified number of periods. It shows whether buying or selling pressure is getting stronger, weaker, or staying neutral. When an asset rises rapidly over several consecutive candles, it has positive momentum. When selling pressure accelerates and prices fall quickly, momentum becomes negative.
Day traders use momentum to assess whether a price move has enough strength to continue or whether pressure is fading, potentially creating an opportunity to exit or prepare for a reversal.
People sometimes mistake momentum for trend. A trend is direction; momentum is the speed behind it.
The Best Momentum Indicators for Day Trading
Momentum indicators compare current prices with historical price data and convert them into readings that help traders assess the strength of a price move.
A good momentum indicator responds quickly without flooding you with false signals. It should also suit your timeframe, since 1-minute charts are noisy and 15-minute charts give fewer entries. These are the best options.
1. Relative Strength Index (RSI)
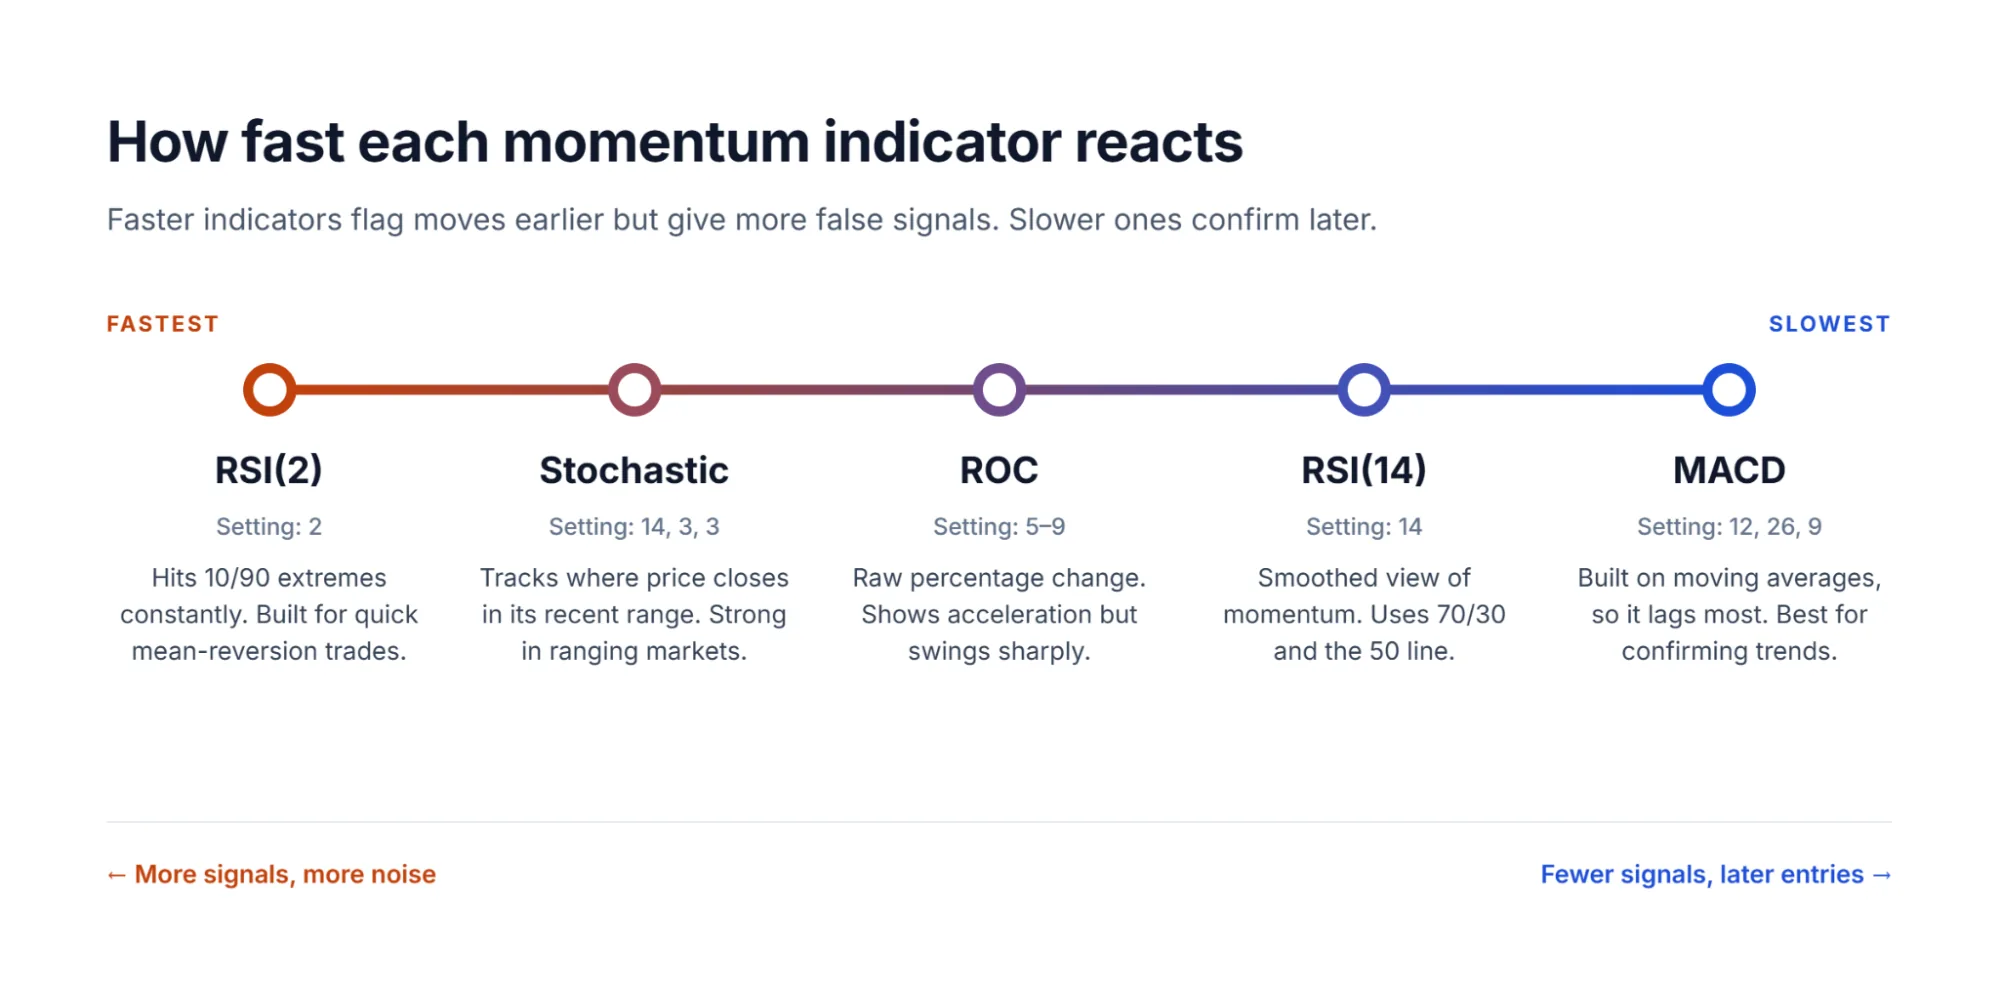
RSI measures the relationship between average gains and average losses over a specified period (see the full calculation on StockCharts).
The standard setting is 14 periods, producing a reading between 0 and 100. Readings above 70 indicate overbought conditions, while readings below 30 indicate oversold conditions. Many traders also watch the 50 line: above it, momentum leans bullish; below it, bearish.
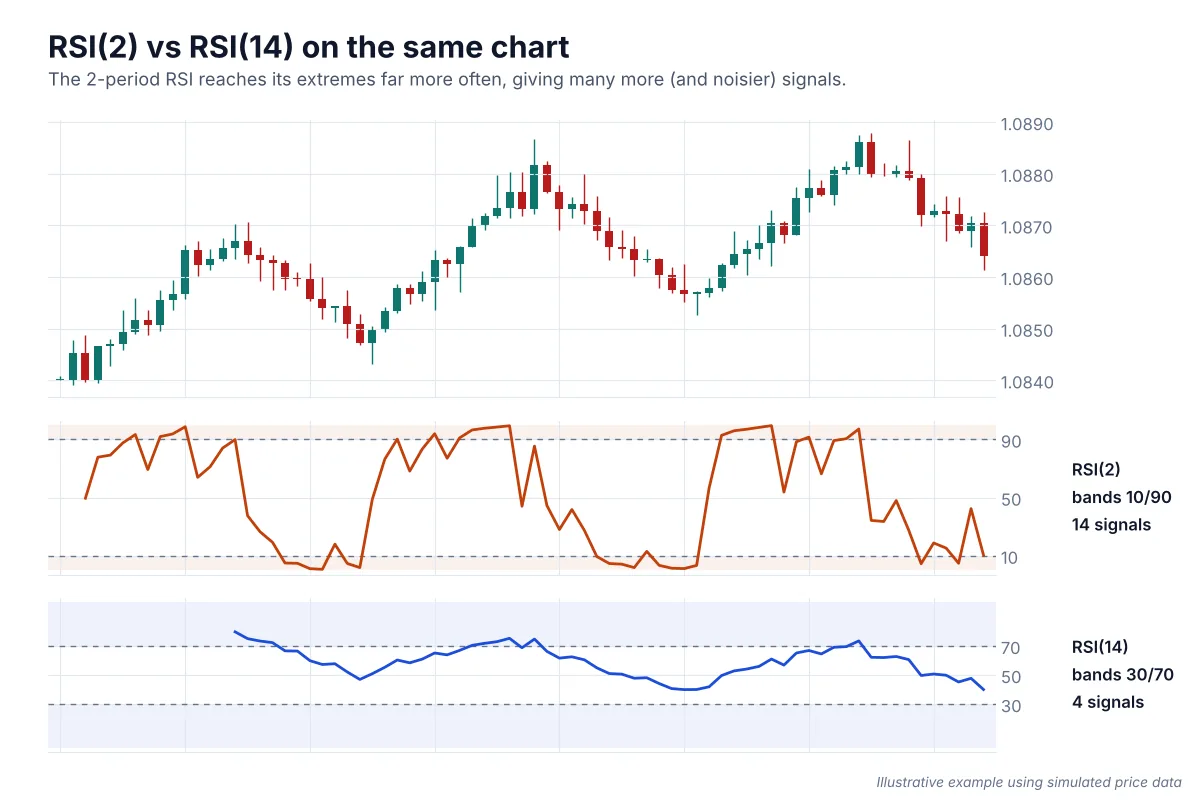
Shorter settings are also popular among intraday traders:
- RSI(2): Highly sensitive to short-term price changes.
- RSI(4): Offers a middle ground between responsiveness and signal frequency.
- RSI(7): Offers a balance between responsiveness and historical context.
- RSI(14): Provides a broader view of momentum.
Suggested starting settings:
- 1-minute chart: RSI 2 or 4.
- 5-minute chart: RSI 4 or 7.
- 15-minute chart: RSI 7 or 14.
Pros: Simple interpretation, adaptable settings, and useful for identifying momentum shifts.
Cons: RSI can remain above 70 or below 30 for extended periods during strong trends.
2. Moving Average Convergence Divergence (MACD)
MACD combines trend-following and momentum analysis (StockCharts explains the calculation).
Its standard configuration is 12, 26, and 9:
- MACD line: 12-period EMA minus 26-period EMA.
- Signal line: 9-period EMA of the MACD line.
- Histogram: Difference between the MACD line and signal line.
A bullish crossover occurs when the MACD line moves above its signal line. A bearish crossover happens when it moves below.
When the MACD line crosses above zero, it indicates rising upward momentum. Crossing below zero indicates intensifying downward pressure.
Suggested intraday settings:
- 1-minute: 6, 13, 5.
- 5-minute: 8, 17, 9.
- 15-minute: 12, 26, 9.
Faster settings can produce earlier signals but may also increase false crossovers. MACD is particularly useful for identifying momentum divergence and confirming trend continuation.
Pros: Combines momentum and trend information; histogram helps visualize changes in momentum.
Cons: Moving-average calculations introduce lag, and crossovers can show up late during rapid price movements.
3. Rate of Change (ROC)
ROC measures the percentage change in price over a selected number of periods (StockCharts).
A positive reading means price is higher than it was at the beginning of the measurement period. A negative reading means it has declined.
For intraday trading, 5- or 9-period ROC settings are decent starting points on a 5-minute chart.
Pros: It's great for assessing breakouts and identifying accelerating price movements. It’s also easy to interpret.
Cons: Highly sensitive to sudden price changes and can experience major fluctuations in volatile markets.
4. Stochastic Oscillator
The Stochastic Oscillator measures the latest closing price relative to the highest and lowest prices over a selected period (StockCharts).
The commonly used full Stochastic configuration is 14, 3, 3, with %D representing a 3-period moving average of %K.
Both lines move between 0 and 100. Readings above 80 indicate overbought conditions, meaning price is closing near the top of its recent range. Readings below 20 indicate oversold conditions, meaning it is closing near the bottom.
Traders also watch for crossovers between the two lines. A bullish signal occurs when %K crosses above %D below 20, suggesting that price is beginning to close higher within its recent range. A bearish signal occurs when %K crosses below %D above 80, suggesting that buying pressure may be weakening.
Pros: This indicator works well in ranging markets, where price repeatedly moves between support and resistance. It identifies short-term turning points and provides clear crossover signals.
Cons: Can produce early reversal signals during strong trends.
Other Momentum Indicators Worth Knowing
- Know Sure Thing (KST): It combines multiple averaged rates of change to identify broader momentum shifts.
- Williams %R: Similar to the Stochastic Oscillator but uses an inverted scale of 0 to -100. Readings above -20 indicate overbought conditions, while readings below -80 indicate oversold conditions.
- Commodity Channel Index (CCI): Measures how far typical price deviates from its statistical average.
- Average Directional Index (ADX): The ADX doesn’t actually measure momentum direction. Instead, it shows how strong a market trend is.
Momentum Indicator Comparison: Making the Right Choice
| Indicator | Best market condition | Intraday settings | Signal type | Main weakness |
|---|---|---|---|---|
| RSI | Range-bound markets for overbought/oversold signals; trending markets for 50-line signals | 14 (default); 7, 4 or 2 for faster readings | Overbought/oversold levels, centreline crosses, divergence | Can remain overbought or oversold during strong trends |
| MACD | Established directional trends | 12/26/9 (default); 8/17/9 as a faster alternative | Signal-line crosses, zero-line crosses, histogram changes | Lags price and produces false signals in sideways markets |
| ROC | Short-term directional moves and momentum shifts | 5-9 periods | Zero-line crosses and changes in the rate of price movement | Can fluctuate sharply and has no fixed overbought/oversold levels |
| Stochastic Oscillator | Range-bound markets and short-term reversals | 14/3/3 (default); 5/3/3 for faster readings | %K/%D crosses, particularly near 80 and 20 | Can remain overbought or oversold during strong trends |
Momentum Day Trading Strategies
Here are some practical techniques you can implement.
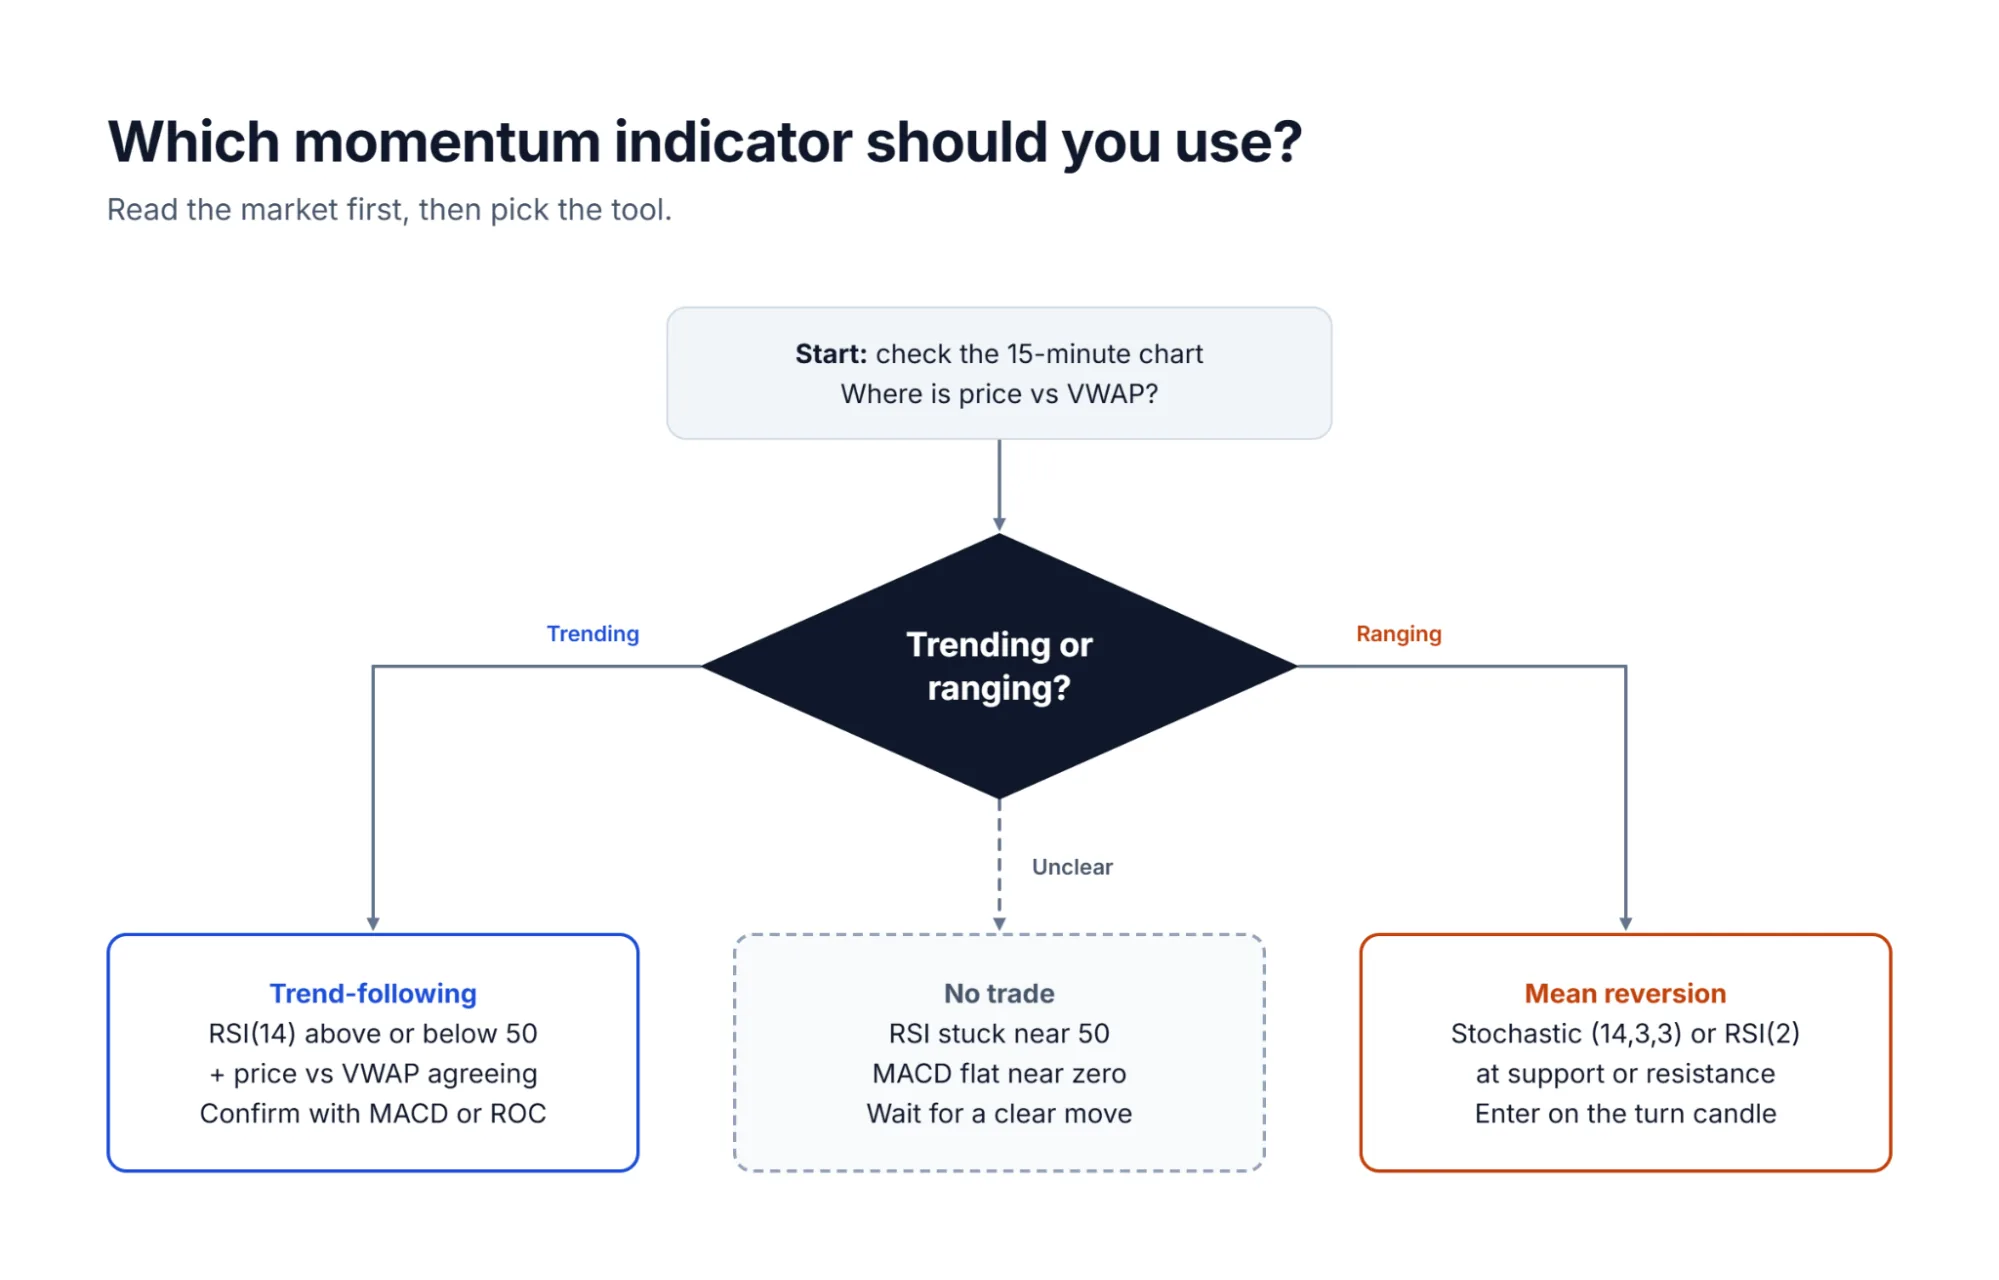
Trend-Following: RSI Above 50 + Price Above VWAP
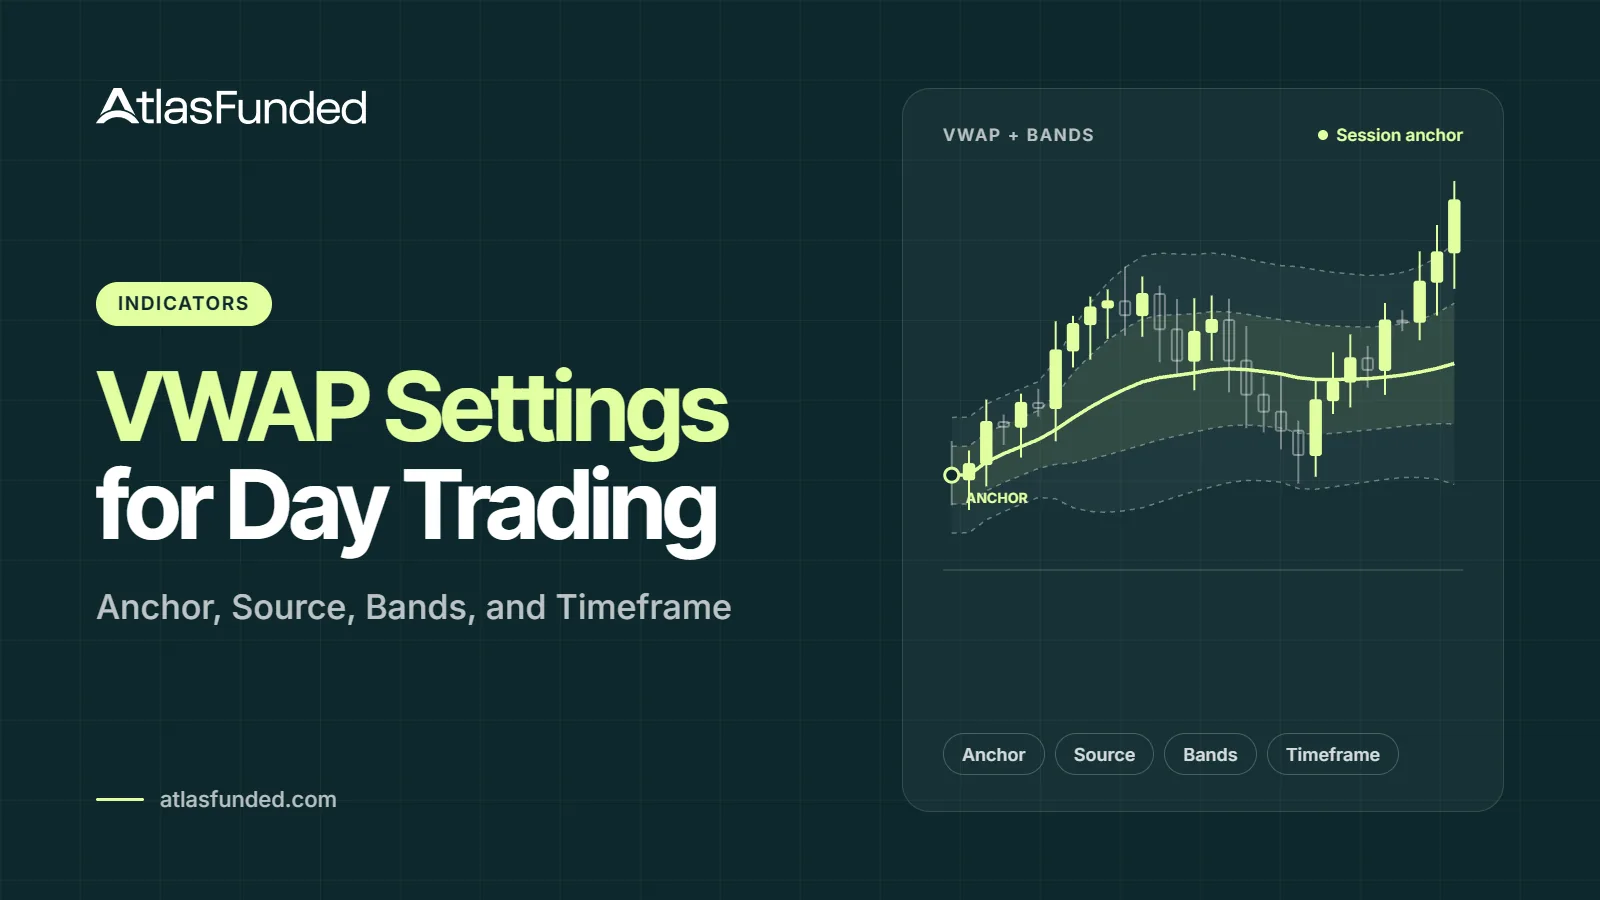
VWAP is the average traded price weighted by volume throughout the trading session. It resets at the beginning of each session and provides a useful reference for intraday direction.
For a potential long trade on a 5-minute chart:
- Price should be trading above VWAP.
- RSI(14) should be above 50.
- RVOL (tick volume for forex) should be above 1, showing above-average participation in the move.
- Wait for price to pull back towards VWAP or nearby support.
- RSI may temporarily weaken towards 40-50 before turning upwards.
- Consider entering when price breaks above the previous candle's high.
Place the stop below the pullback low or the relevant support level. A target offering at least twice the initial risk gives a starting reward-to-risk framework.
For shorts, reverse the conditions: price below VWAP, RSI below 50 and bearish confirmation.
Mean-Reversion Strategy: 2-Period RSI
The 2-period RSI reacts quickly to price changes, making it useful for spotting potential short-term reversals near support and resistance levels.
For a long trade, wait for price to approach an established support level while RSI(2) drops below 10. When RSI rises back above 10, look for a bullish candle to close above the previous candle's high. This suggests buyers are pushing price away from support and provides a possible entry signal.
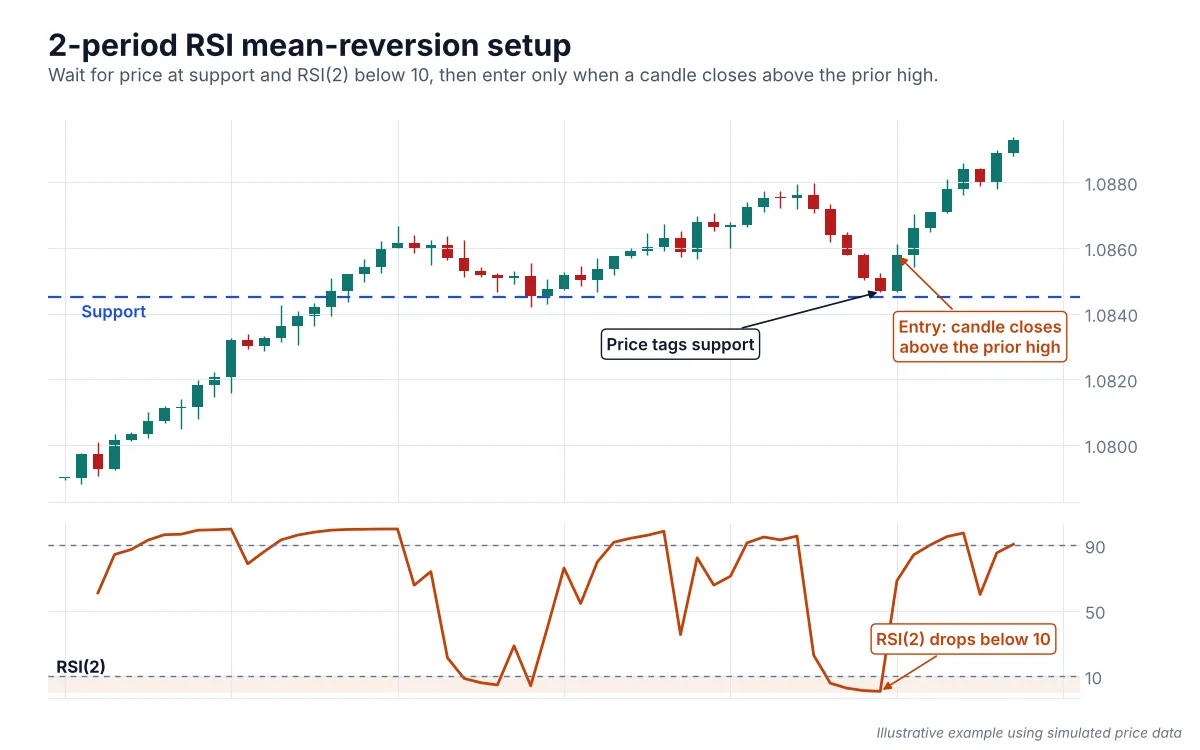
For a short trade, wait for price to approach resistance while RSI(2) rises above 90. When it falls back below 90, look for a bearish candle to close below the previous candle's low. This suggests sellers are pushing price away from resistance.
MACD Divergence Strategy
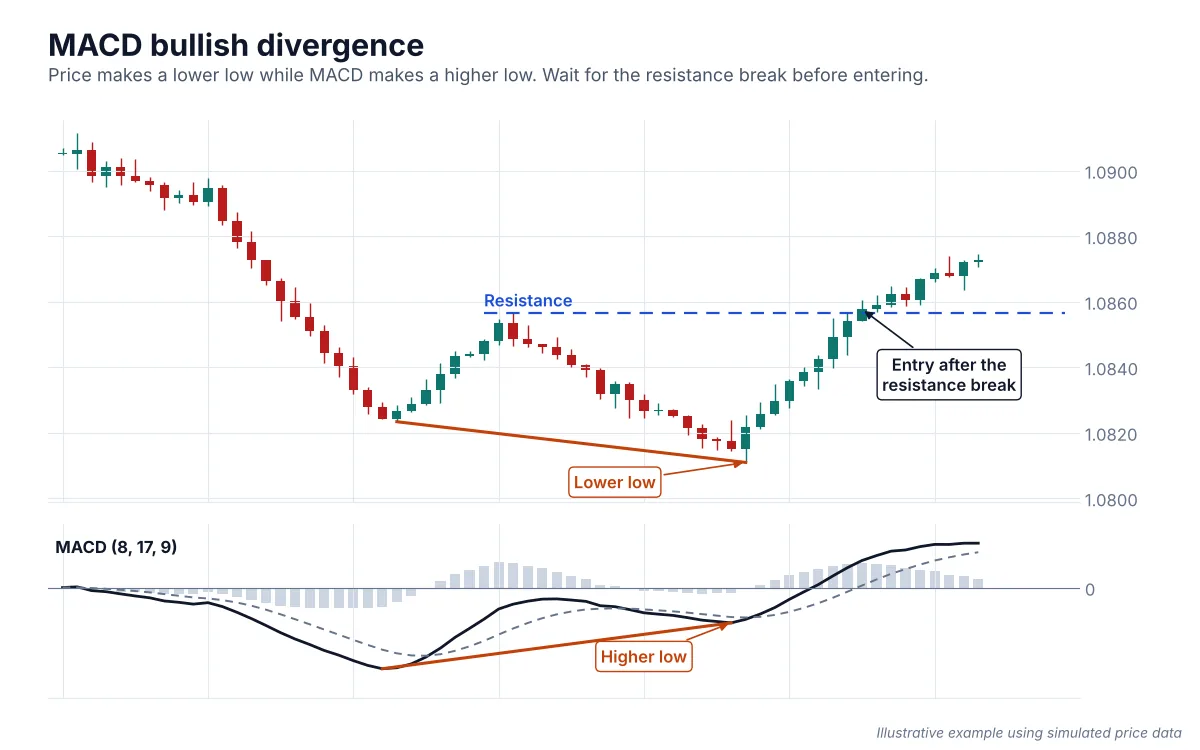
For a long, look for price to make a lower low while MACD makes a higher low. Price dropped further, but the selling behind it was weaker. Don’t jump in yet. Wait for price to break above nearby resistance first.
For a short, flip it. Price makes a higher high, MACD makes a lower high, and the buying is running out of steam. Your entry comes when price breaks below support.
Divergence is a warning sign, not a reversal. Price can keep going the same way for a while, so let the break confirm it.
Worked Intraday Chart Examples
Bullish Example
EUR/USD climbs from approximately 1.1225 to 1.1250, with price staying above VWAP at 1.12289. RSI(7) rises above 70, showing strong upward momentum. When price pulls back, RSI dips to around 50 before turning upwards again. It eventually reaches 77.66 as buyers regain control and price continues higher.
This combination of price holding above VWAP and RSI recovering from its pullback supports a bullish bias. A trader could look for a break above the previous candle's high as a potential entry, placing a stop below the recent swing low.
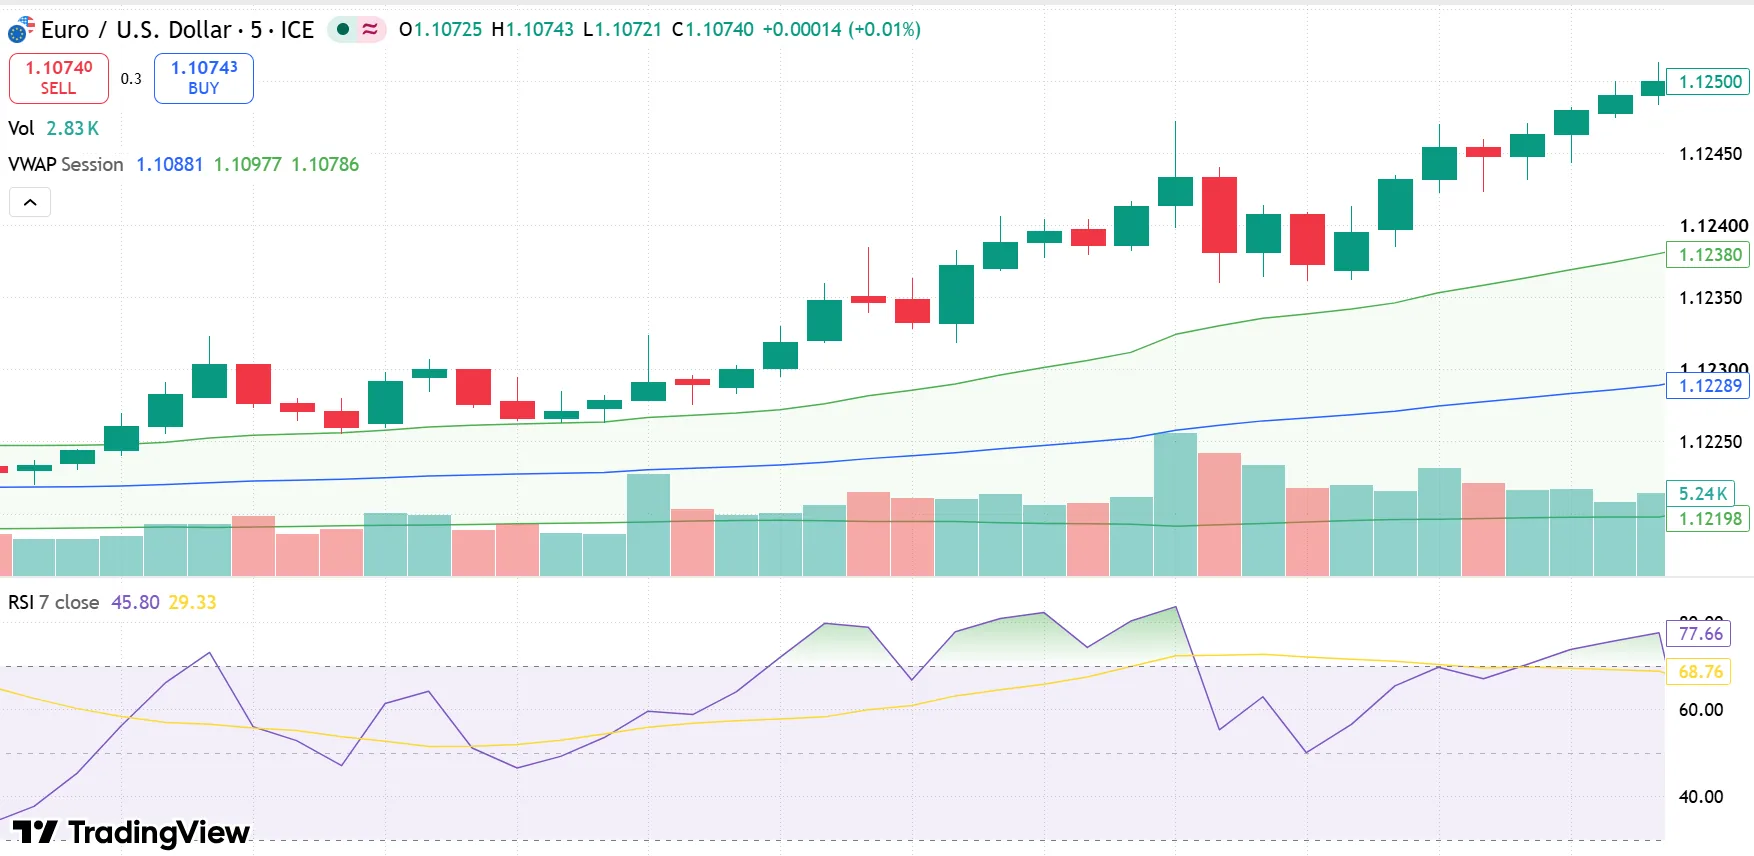
TradingView chart showing pullback and entry candle with VWAP and RSI(7) indicators.
Bearish Example
EUR/USD falls to 1.0230 before recovering towards VWAP at 1.0260. RSI(7) rises from 28 to 47 but remains below 50, suggesting that the recovery has not established strong bullish momentum. Price rejects VWAP and breaks below 1.0252, offering a possible short entry.
A stop at 1.0268 risks 16 pips, while a target at 1.0220 offers 32 pips, giving a 2:1 reward-to-risk ratio.
Mixed Example
EUR/USD trades near VWAP at 1.0500. RSI(7) fluctuates between 48 and 52, while MACD bars stay close to zero. These readings suggest weak directional momentum, making it difficult to identify a clear trading opportunity. Waiting for stronger confirmation makes more sense.
How Reliable Are Momentum Indicators?
Momentum indicators can help traders recognize changes in buying and selling activity, but they don’t predict price movements with certainty. Their signals are most useful when they align with the broader market direction and what price action is showing.
A TeachTrades backtest examined the momentum indicator across 15 forex pairs and 6 timeframes, covering 29,855 trades. It found that the indicator performed similarly to random entries on the same charts, with results improving on longer timeframes. Its strongest results came from daily charts, while five-minute trades showed negative expectancy.
This suggests that the performance of momentum indicators depends partly on the timeframe and trading conditions.
For day traders, this shows that a momentum indicator isn’t a holy grail, and it doesn’t guarantee profitable trades. Use its signals alongside price action and risk management, and test the strategy under realistic trading conditions.
Risk Management and Position Sizing
Even a technically sound momentum setup can fail without proper risk management.
- Set your risk: Choose a fixed percentage of your account to risk per trade. The 1% rule is a common approach, where you risk about 1% of your account on one trade.
- Place your stop-loss: Use market structure, such as below a recent swing low for a long position or above a swing high for a short.
- Practice on a demo account: Test the strategy on different market conditions before risking real capital.
- Calculate position size: Factor in the distance between your entry and stop-loss, along with the instrument's contract size, lot size, or tick value.
- Don’t ignore liquidity: Low liquidity and wide spreads can increase trading costs and make entries and exits harder.
- Don't keep changing settings: Adjusting settings to fit recent price movements can make a strategy unreliable.
FAQs
What is the most accurate momentum indicator?
There’s no single best indicator that works in every situation. RSI is useful for finding overbought and oversold conditions, while MACD helps track changes in momentum and trend direction. Some indicators work better than others depending on market conditions and the type of trade you're looking for.
Is RSI better than MACD for day trading?
They’re both useful, but they serve different purposes. RSI is generally more responsive to short-term price changes and provides clear overbought and oversold levels. MACD is useful for confirming changes in trend and momentum. RSI is a good starting point for entry timing, while MACD can provide additional confirmation.
Can you day trade using momentum indicators alone?
Although possible, relying on momentum indicators alone is not ideal. They do not provide sufficient information about liquidity, support and resistance, trading volume, or suitable stop-loss placement. Combining one momentum indicator with VWAP, volume, and price action gives you a more complete view.
What if your indicators disagree?
Don’t just follow whichever indicator gives the signal you want. Check price against VWAP and your key level first, then higher-timeframe momentum, and use the momentum indicator only to time your entry. If they still disagree, stay out.
Conclusion
The best momentum indicator depends on what you’re looking for. RSI is the most flexible, MACD confirms trends, ROC shows acceleration, and Stochastic spots turning points in ranging markets.
To start, use RSI on a 5-minute chart with VWAP and relative volume. Test your settings, manage your risk, and let the indicator support your decision, not make it for you.
Ready to take the next step? Explore AtlasFunded's prop trading programs today and put your trading skills to work with the capital to match.
Explore funding programs
 Senior Writer at Atlas Funded




 Your move
 Only pay the full fee after you pass

 UK
 ES
 DE
 FR
 IN
 IT