


The opening range breakout (ORB) is an intraday trading strategy that uses the high and low of the first stretch of a market session to identify potential trading opportunities.
You mark that range, wait for price to break out of it, and trade in the direction of the break. The details around confirmation, stops, filters and sizing decide whether the strategy pays off.
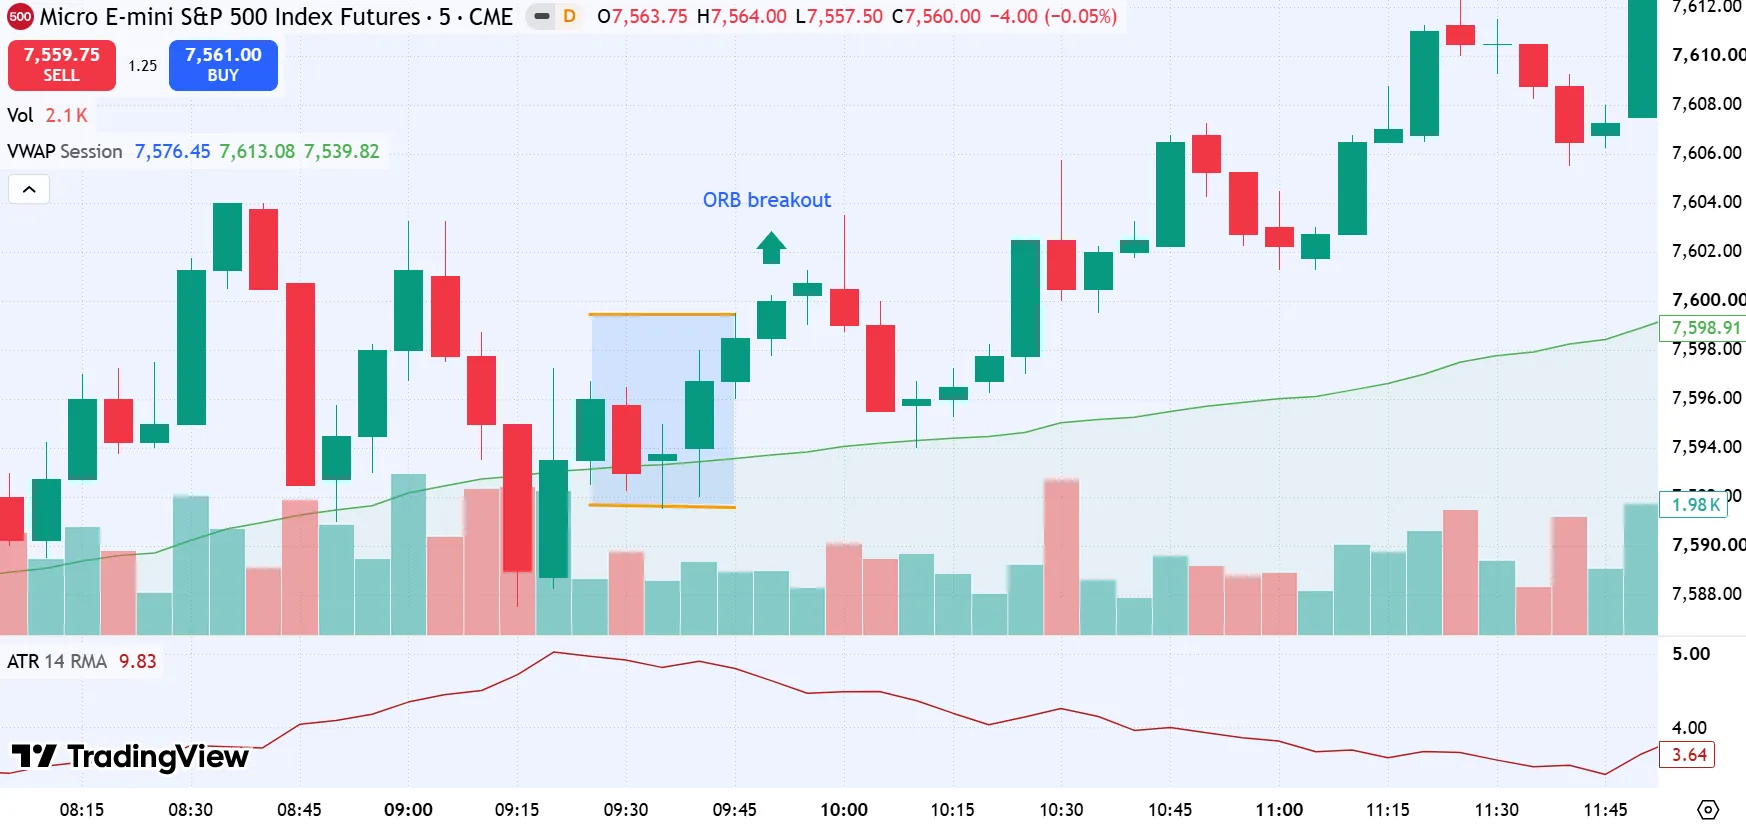
TradingView chart showing 15-minute ORB range
What Is the 15 Minute Opening Range?
The 15-minute opening range is the highest and lowest price printed during the first 15 minutes after a market's regular session opens. On the US cash open, that window runs from 9:30 to 9:45 AM ET. The high and low of that window are your range. These levels create a temporary price boundary that traders use to identify potential breakouts.
Both candle bodies and wicks count when establishing the range. If a candle reaches 5,250 but closes at 5,245, the high is still 5,250. The opening range represents the full price movement during the window, not just where candles open and close.
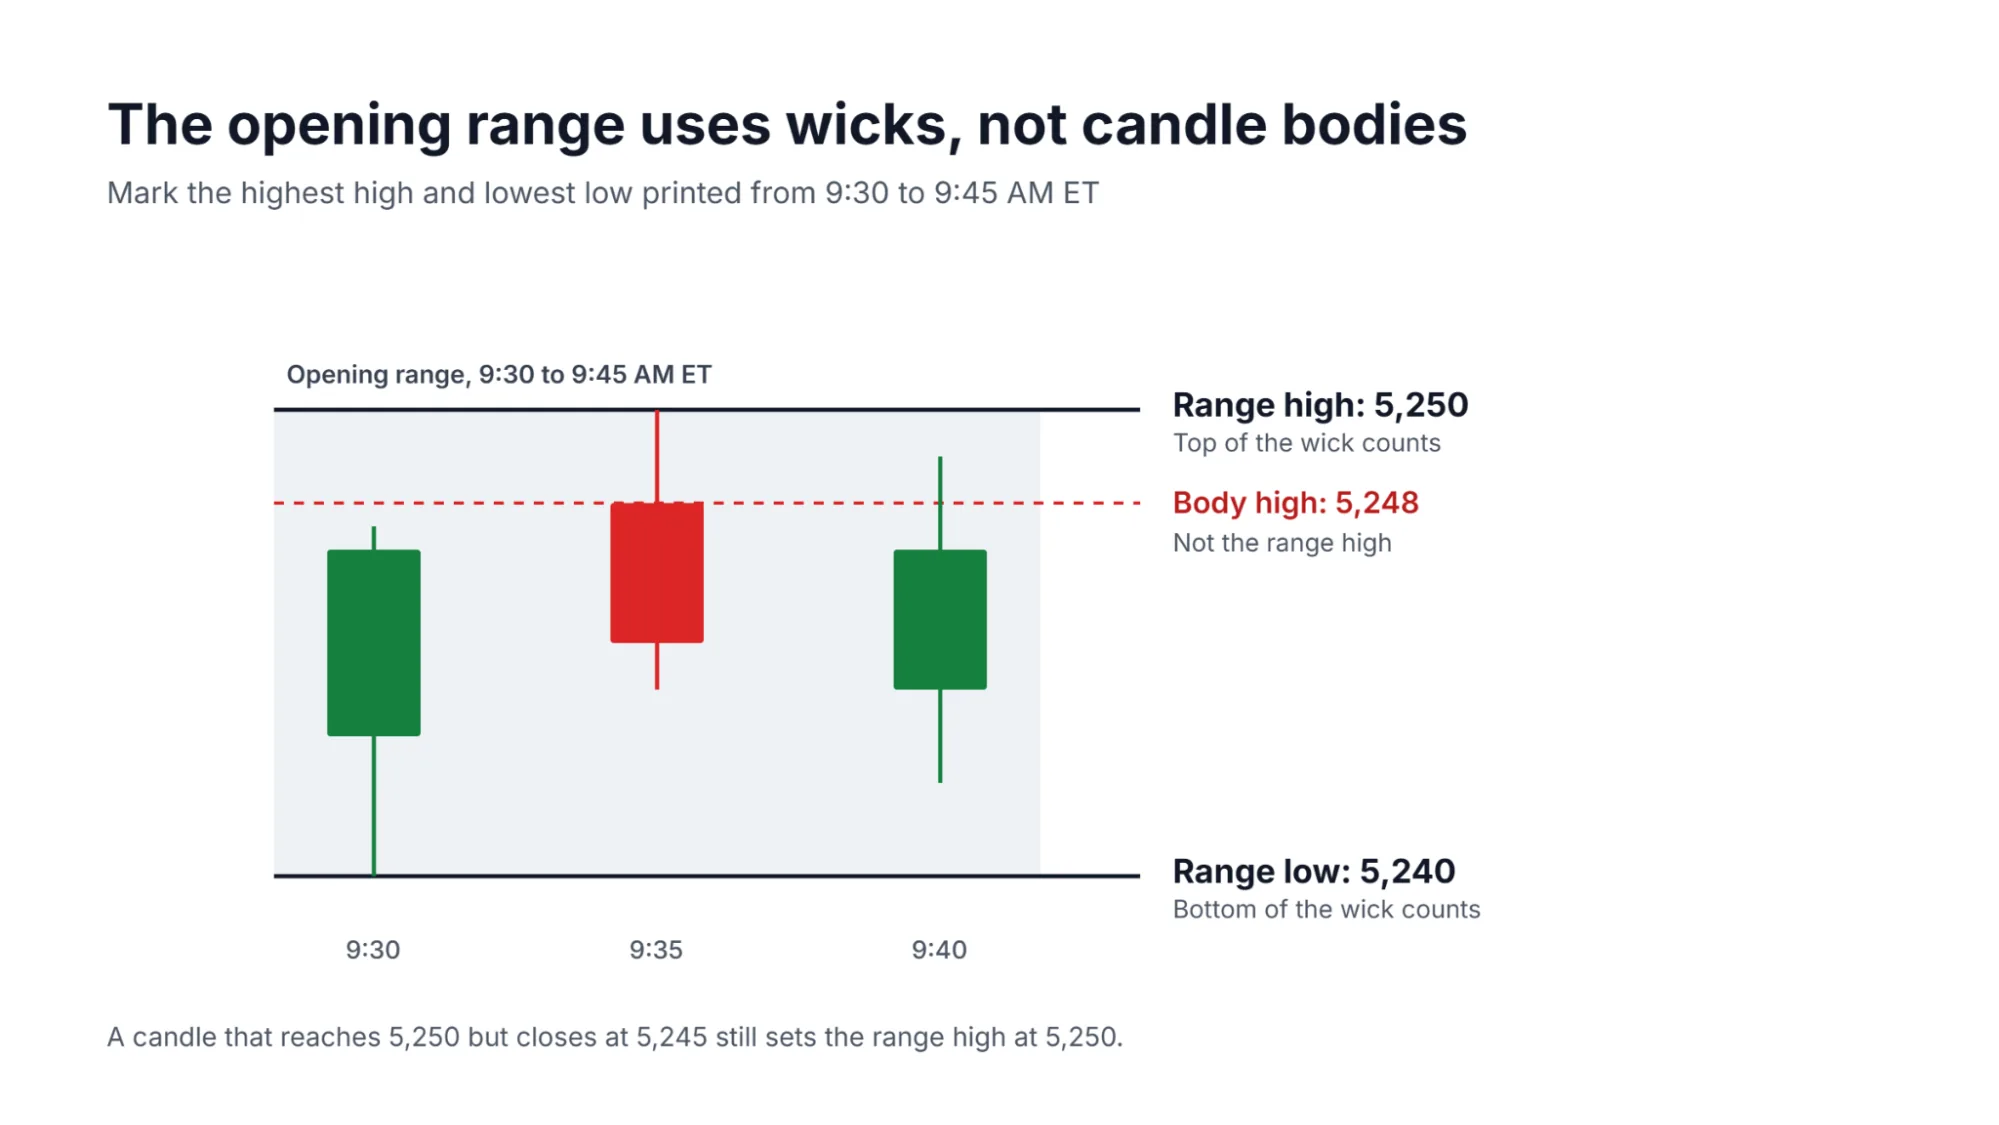
Once the 9:45 AM candle closes, the range is complete. Traders mark the high and low as fixed levels and wait for price to move past either boundary.
So why the first 15 minutes? The open often brings higher volume and volatility as overnight orders, news reactions, and institutional execution enter the market. The range shows where buyers and sellers first established their positions during the regular session.
A break above the high suggests buyers are pushing prices beyond the initial trading area, while a break below the low suggests increasing selling pressure.
Why 15 Minutes? 5 vs 15 vs 30 Minute ORB
Traders run the same idea on different windows. Here is how the three common choices compare in general terms.
| Factor | 5 Minute ORB | 15 Minute ORB | 30 Minute ORB |
|---|---|---|---|
| Reliability | More sensitive to early price movements | Balances early activity with confirmation | Allows more time for the opening trend to develop |
| Signal speed | Fastest | Moderate | Slowest |
| False breakout risk | Can be higher due to early price fluctuations | Moderate | May filter out some early price fluctuations |
| Best suited for | Aggressive scalpers and fast, liquid markets | Intraday traders | Patient traders seeking stronger opening structure |
Best Markets and Opening Range Times
ORB works best in markets that have clearly defined trading sessions and sufficient liquidity around the open. Here are the main sessions traders use.
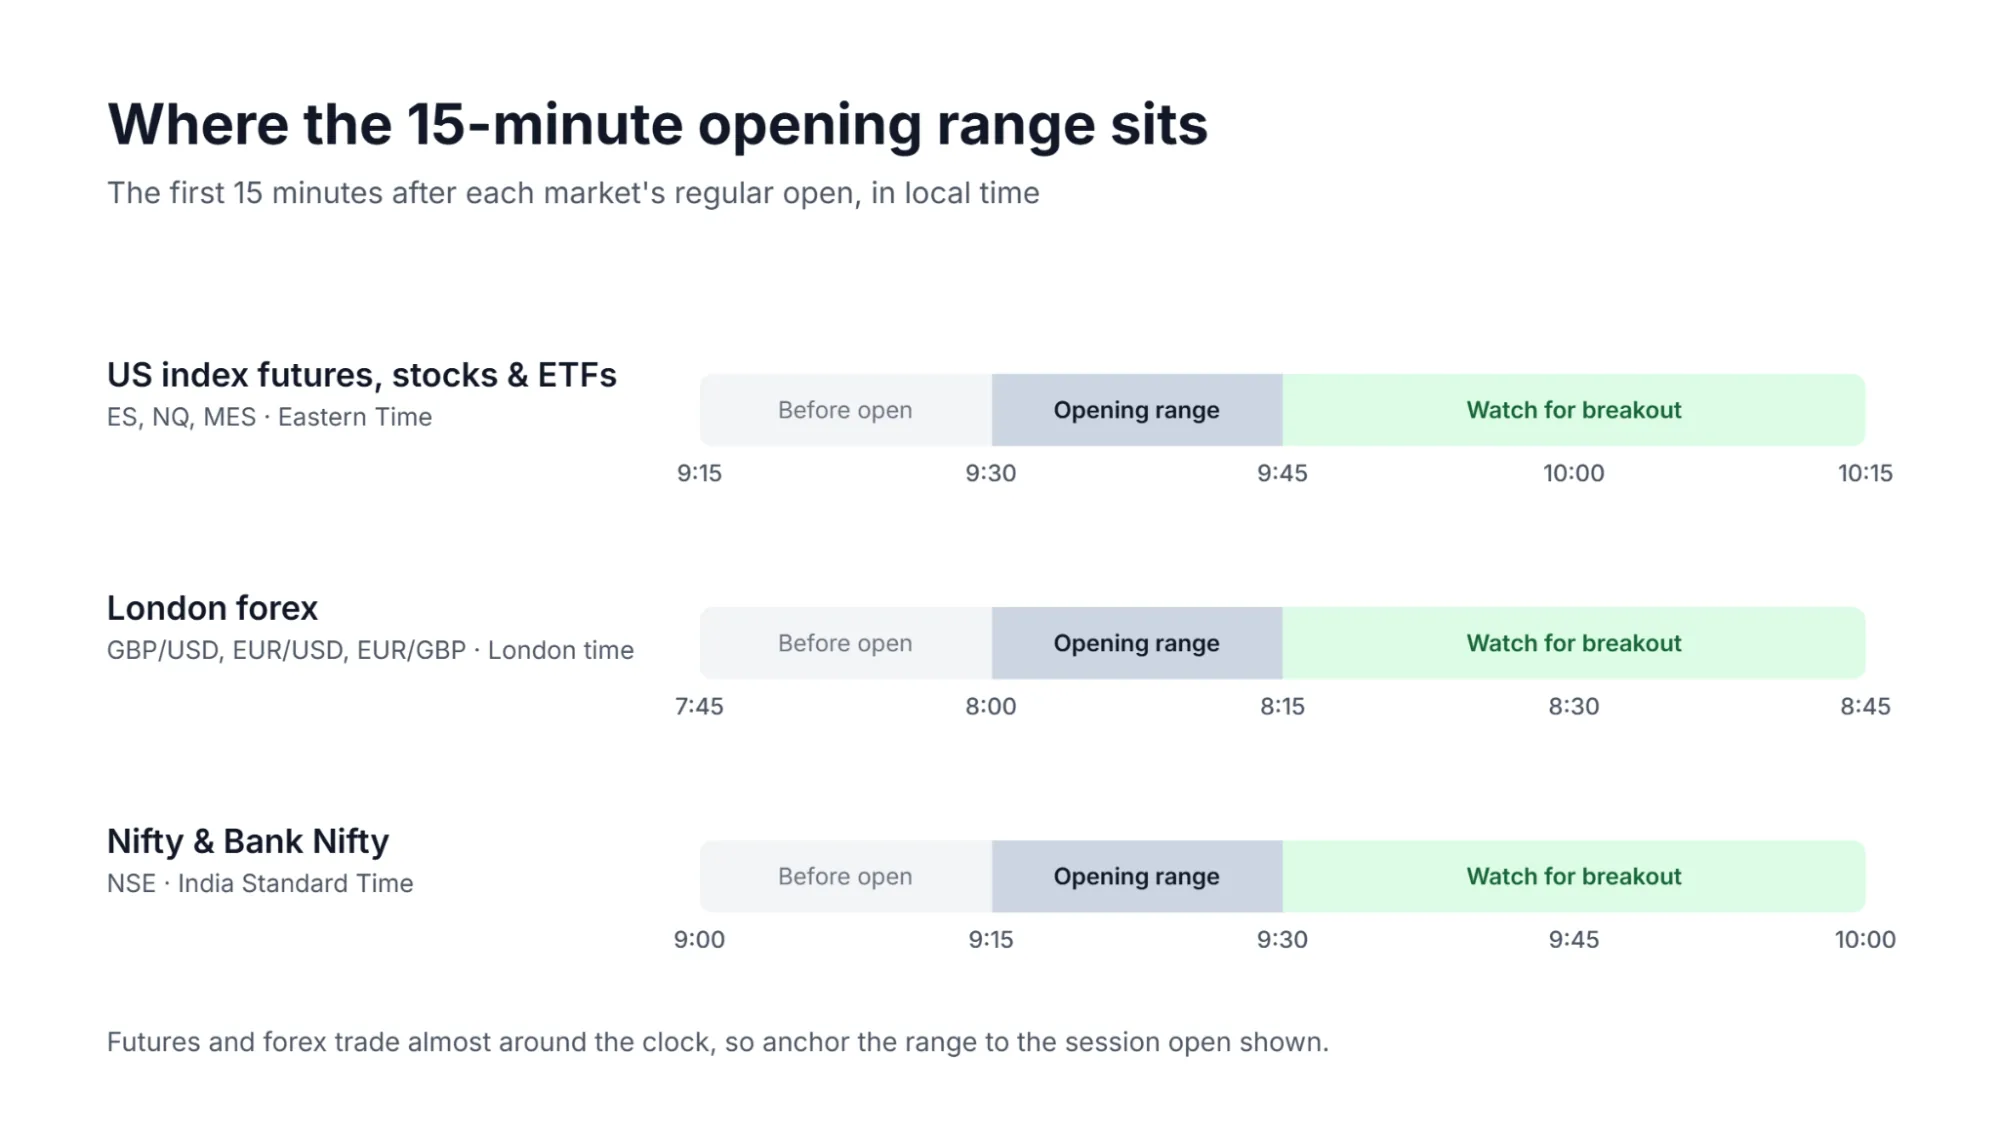
US index futures (ES, NQ, MES), stocks and ETFs: 9:30 to 9:45 AM ET (Eastern Time). Futures trade nearly around the clock, so anchor to the cash open at 9:30. With stocks, favor assets with a catalyst and large trading volume relative to their average.
London forex: 8:00 to 8:15 AM London time. Forex has no centralized opening time, but the London session generally brings increased liquidity and trading activity, particularly for pairs involving the British pound and euro, such as GBP/USD, EUR/USD and EUR/GBP.
Nifty and Bank Nifty: 9:15 to 9:30 AM IST (Indian Standard Time), the first 15 minutes after the NSE opens.
15 Minute ORB Rules, Step by Step
Step 1: Mark the Range
When the 15-minute window ends, draw a horizontal line at the high and another at the low, wicks included. Don't enter any trades during this period. Wait until the full 15 minutes have elapsed.
Step 2: Wait for a Confirmed Breakout
Once the range forms, watch for price to move above its high or below its low. A wick crossing the boundary does not necessarily confirm a breakout. Price can briefly move beyond a level before returning inside the range. Waiting for a full candle to close beyond the range gives you a much stronger confirmation.
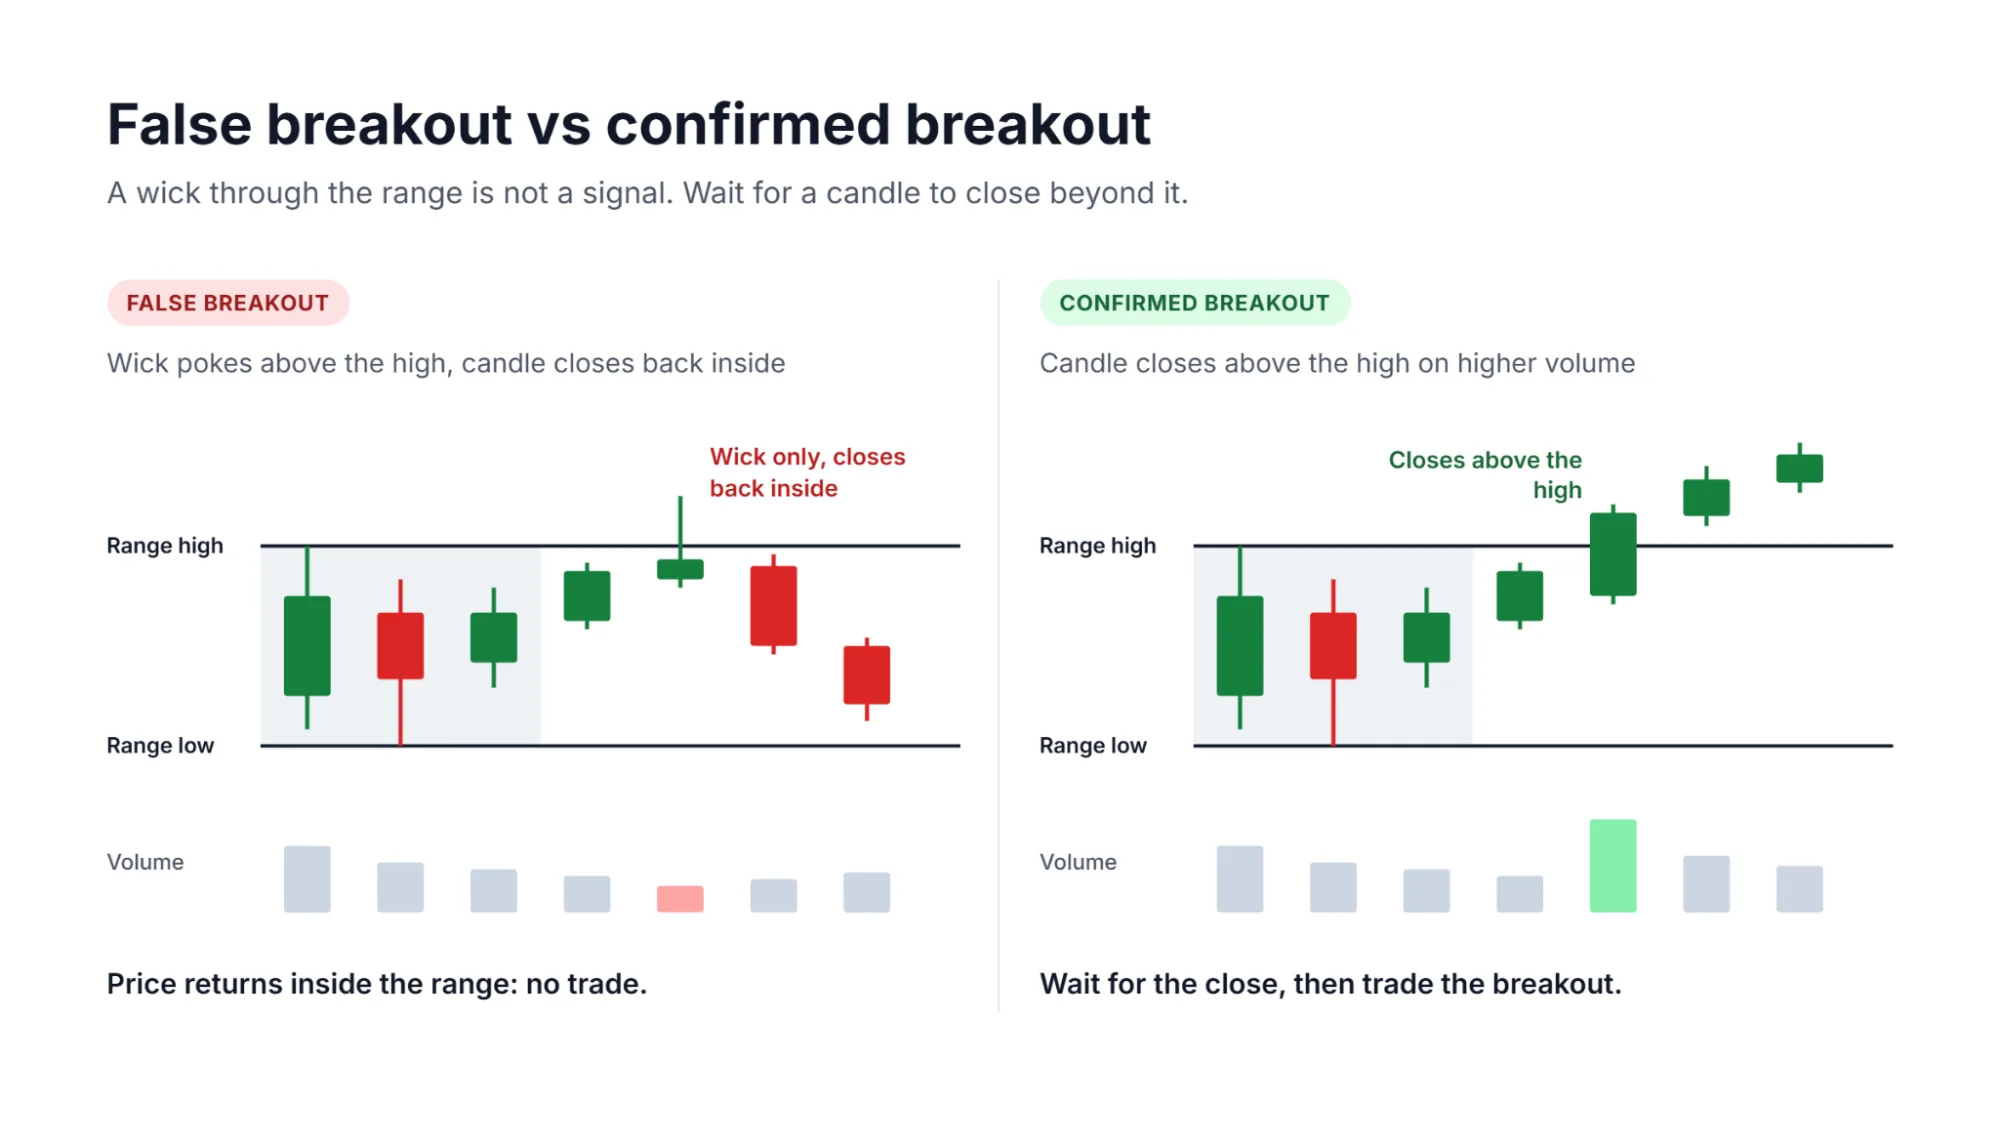
You can use either 1-minute or 5-minute confirmation. A 1-minute chart provides earlier signals, while a 5-minute chart requires more sustained movement. Volume can provide additional confirmation.
A breakout followed by higher-than-average volume suggests stronger market participation behind the move. However, more volume doesn't guarantee continuation, so traders should still watch how price behaves after crossing the opening range.
Step 3: Enter
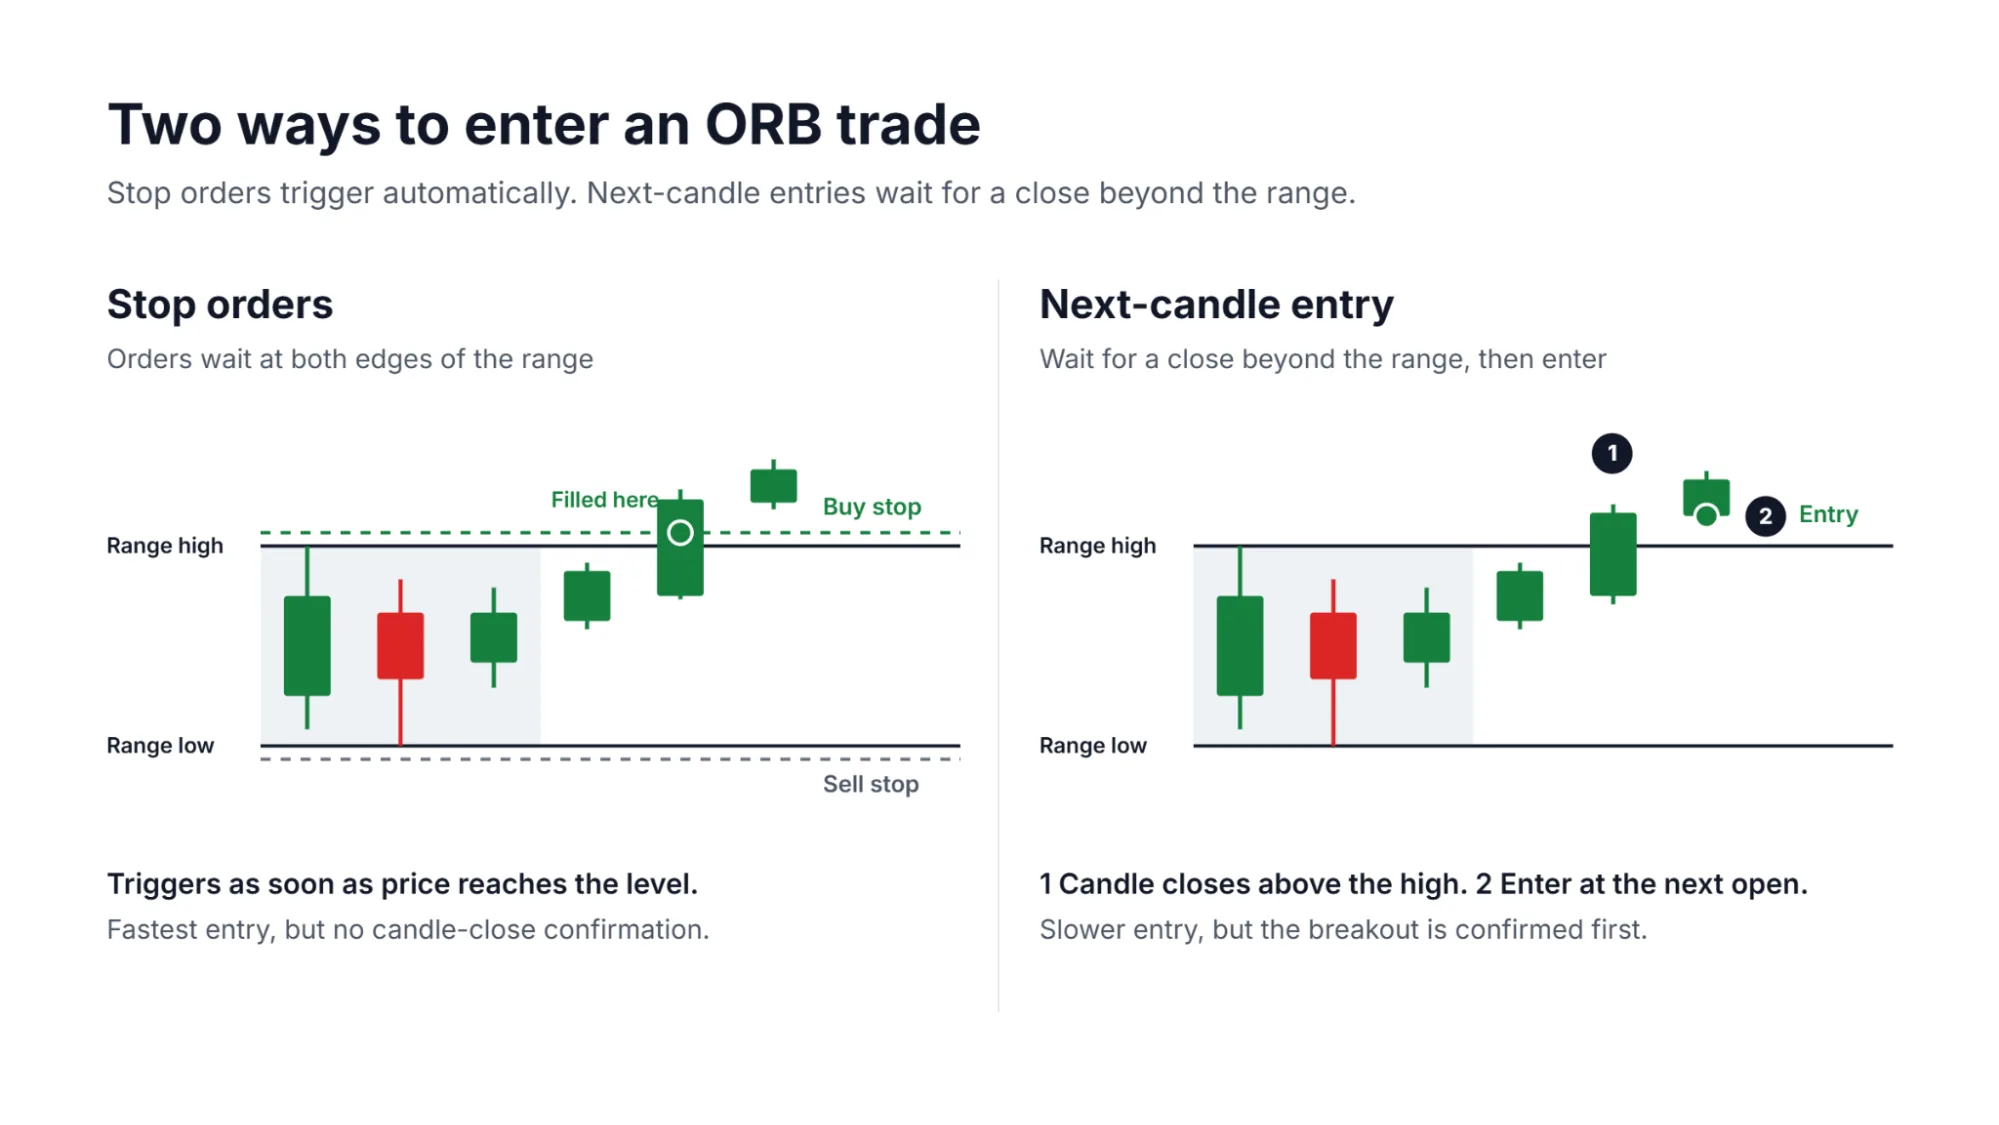
There are two common ways you can enter trades for this strategy:
Stop orders: Place a buy-stop above the opening range high and a sell-stop below the range low. This allows you to trigger automatically when price reaches either level, without waiting for a candle to close beyond the range.
Next-candle entry: Wait for a candle to close beyond the range, then enter at the opening of the next candle. This approach requires breakout confirmation before entering.
Step 4: Set the Stop Loss
The classic approach is to set the stop loss on the opposite side of the opening range, or just inside it. For a long position, the stop goes below the range low. For a short position, it goes above the range high.
A common problem is that wide ranges create wide stops. An ATR-based stop offers an alternative. ATR (Average True Range) measures the average price movement over a selected number of candles.
Using 1 to 1.5 times the 14-period ATR on the 5-minute chart, place the stop that distance below your entry for a long position or above your entry for a short position. This adjusts the stop distance to recent market volatility.
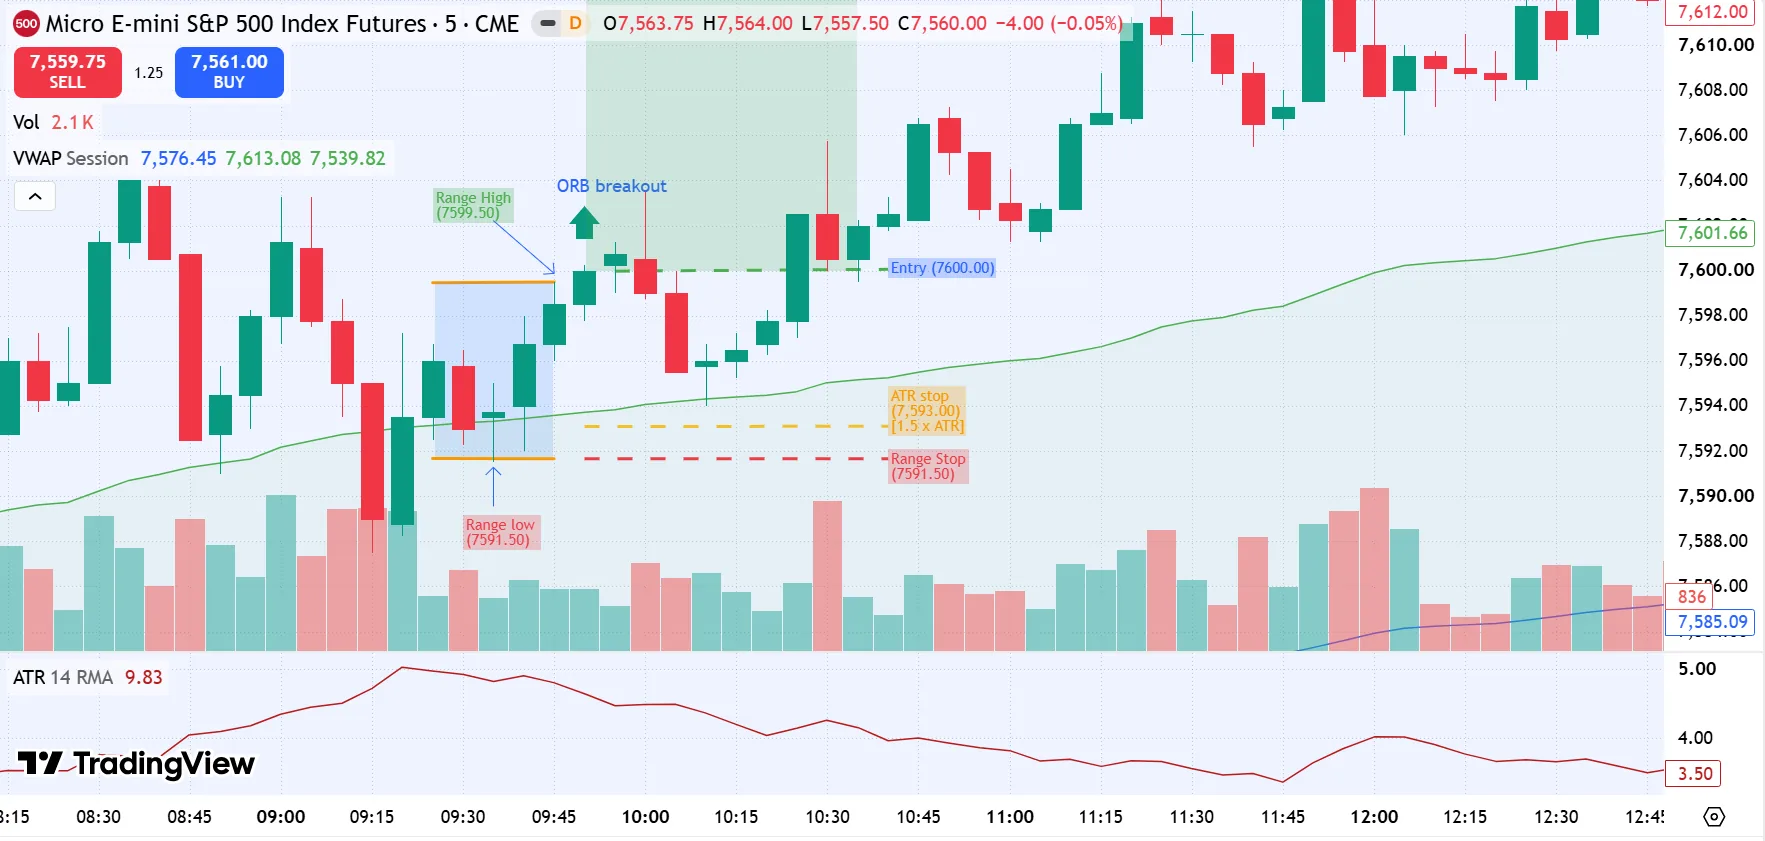
TradingView chart showing Range and ATR stop loss
Step 5: Set Targets and Manage the Trade
There are several methods that can help you determine when to exit.
R-multiples: Take profit at a fixed multiple of your initial risk, such as 1.5R or 2R. A 2R target means aiming to make twice the amount risked.
Measured move: Project the height of the opening range from the breakout level. A 12-point range suggests a 12-point target.
Trailing stop: Trail behind recent swing lows (for longs) or swing highs (for shorts) on the 5-minute chart. This lets you stay in the trade while the price continues moving in your favor, potentially capturing more of a sustained intraday trend.
Break-even: Move the stop to the entry price after the trade reaches a predetermined profit level.
Time exit: Close the position if the trade hasn't played out by a set time, or the session is about to end.
Filters That Improve the 15 Minute ORB
The basic ORB setup can generate several signals, including breakouts that fail shortly after entry. Filters help traders avoid some lower-quality opportunities.
Higher-timeframe trend: Check the 1-hour or 4-hour chart for the broader market direction. A breakout that aligns with the prevailing trend may have better conditions for continuation than one moving directly against it.
VWAP: Look for longs above VWAP and shorts below it. A breakout in the same direction adds another confirmation.
Gap size: Compare the opening price with the previous session's close. A large gap often means much of the expected move has already played out, and it tends to produce an oversized range. Small to moderate gaps in the direction of the break are usually cleaner.
Time cutoff: Set a deadline for taking new trades. For instance, you could ignore breakouts after 11:00 AM ET. This prevents late entries when the initial opening momentum has already faded.
When Not to Trade the ORB
Some sessions create poor conditions for opening range breakouts. One of these is news days. Avoid trading immediately around major economic announcements, such as Federal Reserve decisions, inflation reports, and employment data. These events can produce sudden price movements, wider spreads, and very sharp reversals.
Expiry days can also create unusual volatility and position adjustments. Weekly expiries on Nifty and monthly expiries on Bank Nifty, along with monthly options expiry in the US, can influence price movements for reasons unrelated to the opening range.
Holidays and shortened sessions often lead to lower market activity and less predictable price action.
You should also pay attention to the size of the opening range. An unusually narrow range may produce frequent false breaks, while an excessively wide range can make the stop loss too large for your risk limit.
15 Minute ORB Example Trade
Let’s look at an example. The chart below shows a long 15-minute ORB trade on Micro E-mini S&P 500 futures (MES) on a 5-minute chart. One point is worth $5 per contract, and one tick (0.25 points) is worth $1.25.
MES 5-minute chart with the opening range, entry, both stop options, and session VWAP marked.
The setup
- Range (9:30 to 9:45 AM ET): High 7,599.50, low 7,591.50, so 8 points wide.
- Entry: Long at 7,600.00, the open after a 5-minute candle closes above the range high. Session VWAP sits about 6 points below price, so the trade passes the VWAP filter.
- Stop: The ATR stop is 7,593.00 (1.5 times ATR), or 7.00 points of risk. The range stop at 7,591.50 would have risked 8.50 points.
- Target: 1.5R, which is 10.50 points higher at 7,610.50.
Price tested the trade right away. By 10:10 AM, it had dropped about 6 points to roughly 7,594, level with VWAP and about a point above the ATR stop, before buyers stepped in.
Risking 1% of a $25,000 account is $250. At $35 of risk per MES contract (7.00 points x $5), that allows 7 contracts and $245 of actual risk. The exit earns 10.50 points x $5 x 7 contracts = $367.50. After about $8.75 in fees, the net P&L is $358.75, or about 1.46R.
Win Rate, Risk and Position Sizing
Win rate doesn't mean much without reward-to-risk. The break-even win rate is 1 divided by (1 + R). At 1:1, you need to win 50% of trades. At 1:2, you need only 33.3%. At 1:3, 25% is enough. Costs push those thresholds up a bit.
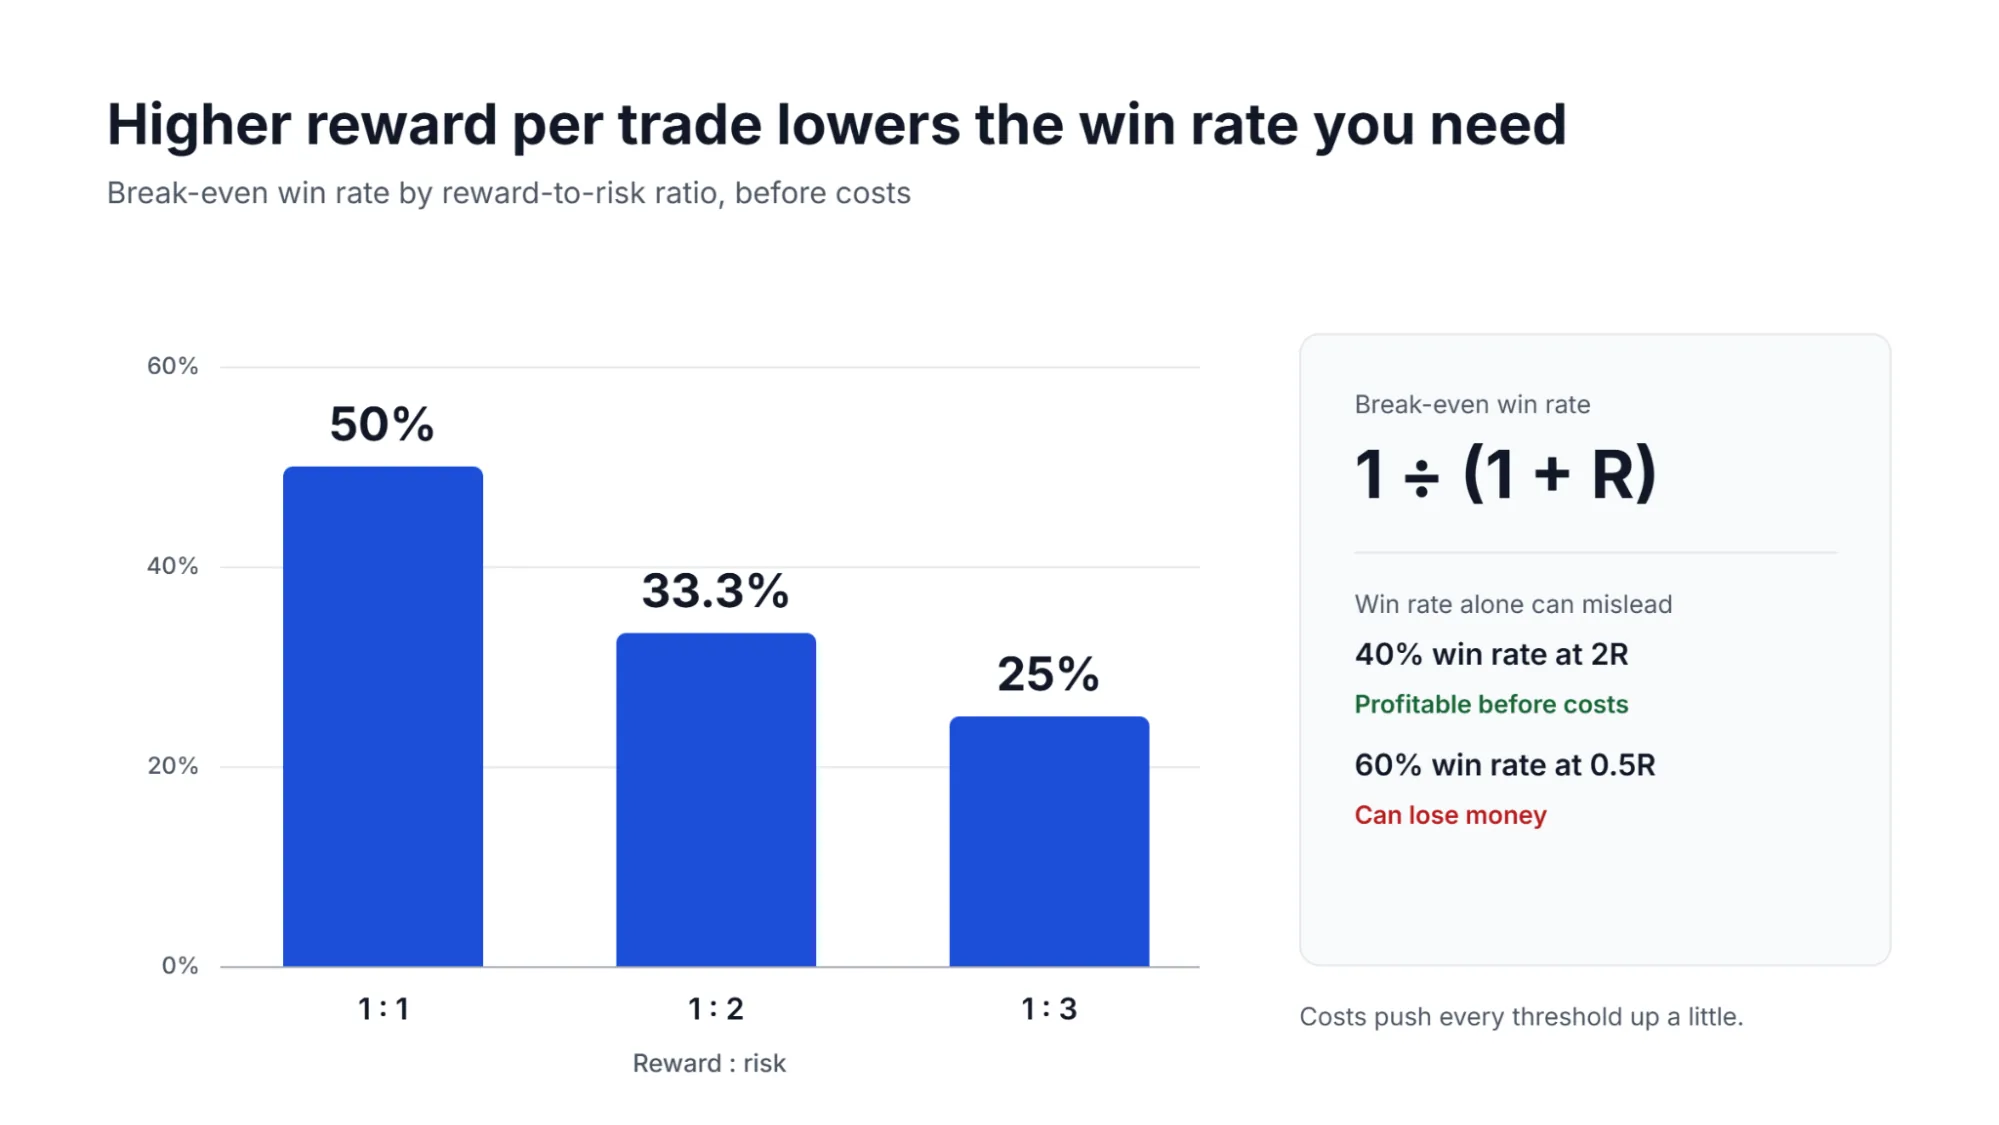
A strategy that wins 40% of its trades but averages 2R per winner can be profitable before costs. A strategy winning 60% but averaging only 0.5R per winner may lose money.
Profit factor (gross profit divided by gross loss) gives a fuller picture. Say you win 4 of 10 trades at 2R and lose 6 at 1R. That is 8R in profits against 6R in losses, a profit factor of 1.33 and an expectancy of +0.2R per trade.
Expect losing streaks. The chances of this increase as you take more trades, so account for losing periods when setting position sizes. A sensible method to handle this is to risk a small percentage of account equity on each trade. Some traders use 1% to 1.5%, although the appropriate amount depends on factors like risk tolerance and account size.
Position size should reflect the distance between entry and stop, not a fixed number of contracts. Let's say your risk allowance is $100 and your stop represents $60 per MES contract. You can trade one contract without exceeding the limit. Two contracts would expose you to $120 of initial risk.
Finally, consider limiting yourself to one trade per side or one completed ORB trade per session. Repeatedly entering every small movement around the range can increase costs and expose you to unnecessary losses.
Common Mistakes
Entering before the range completes: Trading before the 15-minute window closes means the opening high and low are not yet established.
Chasing late breakouts: Entering after price has already moved far beyond the range can leave insufficient room for a reasonable profit target.
Overtrading: Taking repeated entries after failed breakouts can quickly increase losses.
Widening stops: Moving a stop further away because you hope the trade will recover turns a manageable loss into a much larger one.
How to Practice and Journal ORB Trades
Before trading the strategy with real money, you can start by testing it using historical charts and a paper trading account. Start with one market and one opening window. Apply the same breakout confirmation, stop placement, and profit target rules across multiple sessions.
When you go live, trade micro contracts such as MES or MNQ. They offer small contract sizes and allow mistakes to stay manageable.
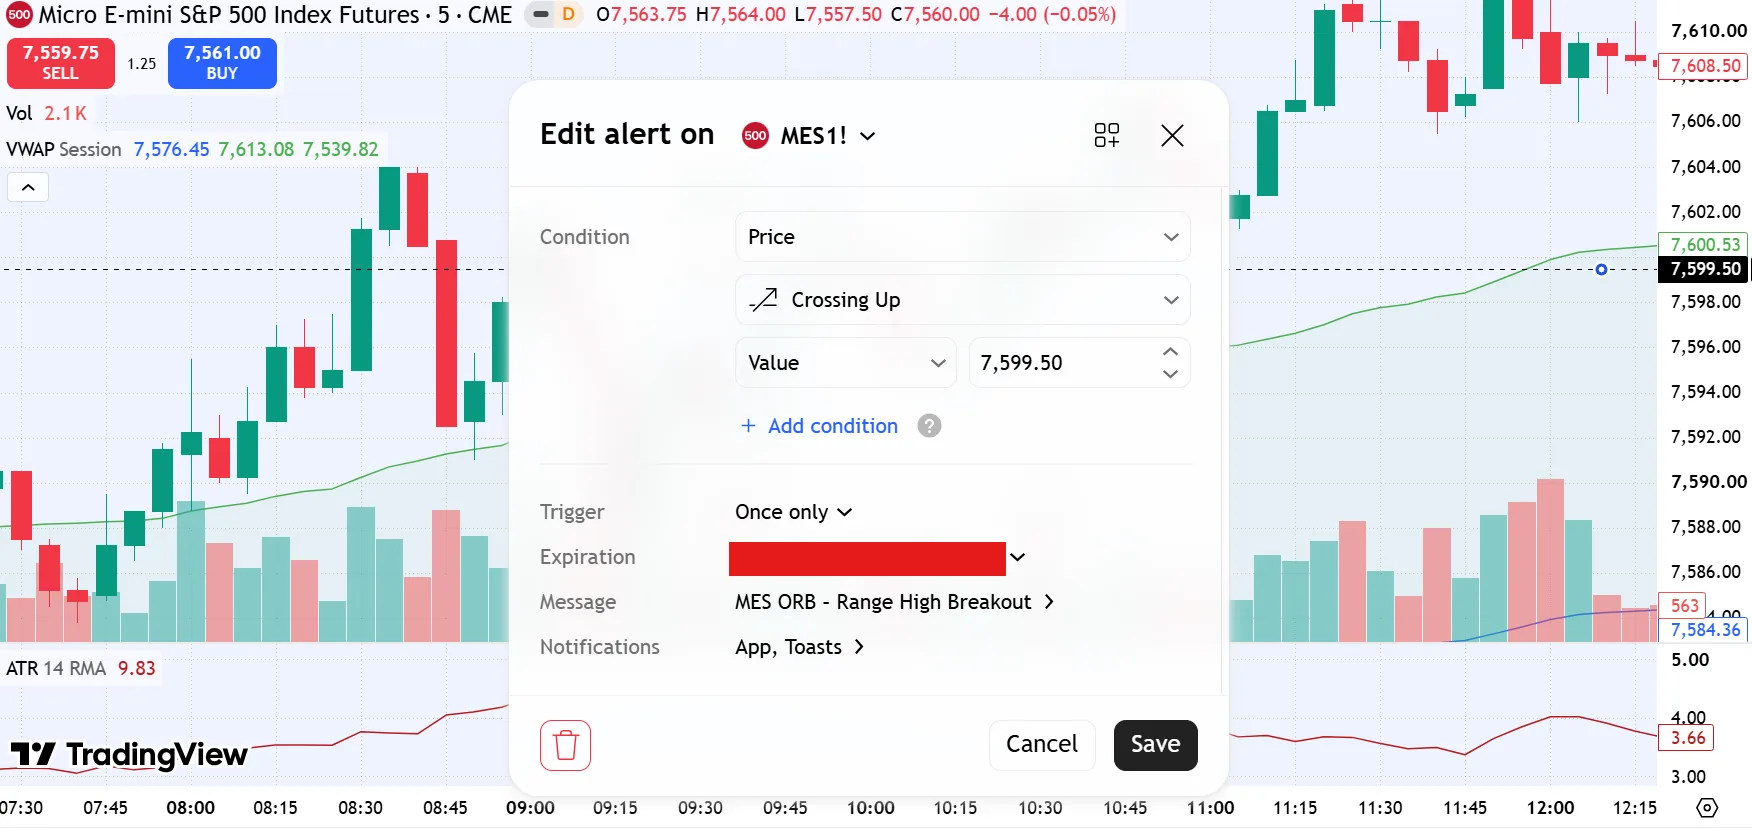
You can also use TradingView alerts to notify you when price crosses the opening range high or low. This reduces the need to constantly monitor every candle, although you should still confirm the signal before entering if your strategy requires a candle close.
Keep a trading journal. For every trade, log the date, market, range width, breakout time, entry, stop, target, result, which filters were present, a screenshot, and notes on any rule you broke.
Conclusion
The 15-minute opening range breakout strategy gives intraday traders a structured way to identify potential opportunities around a market's open. By using the first 15 minutes to establish key price levels, traders can wait for a confirmed breakout before committing capital.
Entry confirmation, stop placement, position sizing, and market conditions all influence how well the strategy will work. Pick your market, test your confirmation and exit rules on a meaningful sample, apply a few filters, and keep your risk small.
Ready to take the next step? Explore AtlasFunded's prop trading programs today and put your trading skills to work with the capital to match.
Explore funding programs
 Senior Writer at Atlas Funded






 Your move
 Only pay the full fee after you pass

 UK
 ES
 DE
 FR
 IN
 IT